| TSPLIB Instance | Boxplot of normalized results (click to download eps format) |
|---|---|
lin318 |
 |
rat783 |
 |
nrw1379 |
 |
pr2392 |
 |
by Max Manfrin, Thomas Stützle, Mauro Birattari, and Marco Dorigo
March 2008
| Table of Contents |
The increasing availability of parallel hardware encourages the design and the adoption of parallel algorithms. Maximizing the degree to which a parallel platform is capable of efficiently utilizing increased computing resources is the challenge to be faced. In this article, we present a study in which, by means of a design of experiments approach, we analyze the impact that communication policies have on the solution quality reached by a parallel homogeneous multi-colony ACO algorithm for the traveling salesman problem. We adopt a full factorial design, empirically testing the treatments on a distributed-memory parallel architecture, and analyzing the results with a multi-factor analysis of variance. We consider several factors that influence the performance of a multi-colony ACO algorithm: the number of colonies, migration frequency schedules, communication strategies on different interconnection topologies, and the usage of local search. Conclustions are drawn about the performance of the different policies. It is shown that the adopted policy has a large influence on the actual performance of the algorithm.
Keywords: ant colony optimization, parallel programming, traveling
salesman problem, communication policies, message passing
We present a study of various communication policies for a parallel homogeneous multi-colony MAX-MIN Ant System (MMAS) by means of a design of experiment approach. The idea of the multi-colony approach is to have several colonies running in parallel that exchange information to intensify the search for solutions toward promising regions of the search space, preserving, at the same time, the tendency of each colony to explore the search space differently. We use factorial experiments based on a full factorial design, extensively testing the parallel variants on the TRAVELING SALESMAN PROBLEM (TSP) using message passing libraries and a distributed-memory parallel architecture; we analyze the impact of the factor studied on solution quality with a multi-factor analysisi of variance (ANOVA).
We modify version 1.0 of ACOTSP, adding the quadrant nearest neighbors heuristic with 20 neighbors and the MPI
code to implement the communication among different colonies.
For the policies we consider several factors: the number of colonies
(2 levels: 4 and 8 colonies of 25 ants each), migration frequency schedules (2 levels:
fixed and increasing), communication strategies on different interconnection topologies
(4 levels: unidirectional ring [R] over the ring topology, hypercube [HC] over
the hypercube topology, fully-connected [FC] and replace-worst [RW] over the
fully-connected topology), and usage of local search or not (3 levels:
no local search, 2-opt local search, and 3-opt local search).
All cited factors result in 2*2*4*3=48 different treatments.
The response variable is the percentage error from the known optimal cost.
To evaluate the quality of the parallel variants we compare them with the parallel independent runs [PIR] approach. Moreover, we also test the single colony MMAS algorithm (SEQ) running for k-times number of iterations as the parallel algorithms, where k=4 or 8 depending on the number of colonies.
The naming convention for the treatments is the following: a number, indicating how many identical colonies are used (4 or 8), is followed by the communication strategy label of the algorithm (PIR, R, RW, HC, FC, SEQ), and then by a letter indicating the adopted migration frequency schedule (f for the fixed one, i for the increasing one); finally a number indicating the adopted local search (0 for no local search, 2 for the 2-opt local search, and 3 for the 3-opt local search). Please note that the algorithms implementing PIR and SEQ strategies do not have in their names the migration frequency schema's letter. Moreover, the initial number for the algorithms implementing the SEQ strategis, identifies the multiplier factor for the number of iterations. For example the label 4RWf2 identifies a treatmnet with 4 identical colonies, a replace-worst strategy on a fully-connected topology, adopting fixed-frequency migration schedule and a 2-opt local search; while the label 8PIR3 identifies an algorithm with 8 identical colonies, a parallel independent runs strategy on an isolated topology and 3-opt local search. The label 4SEQ0 identifies a treatment with 1 colony that runs for 4 times the number of iterations of the parallel treatments and no local search.
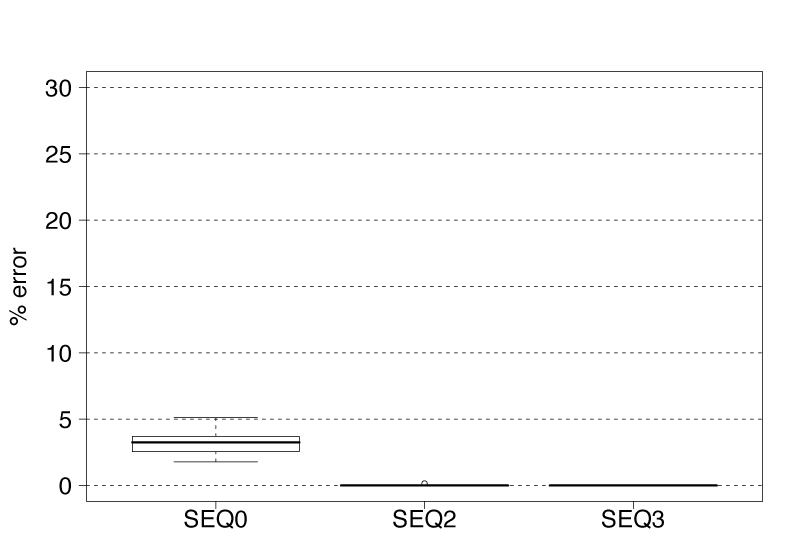
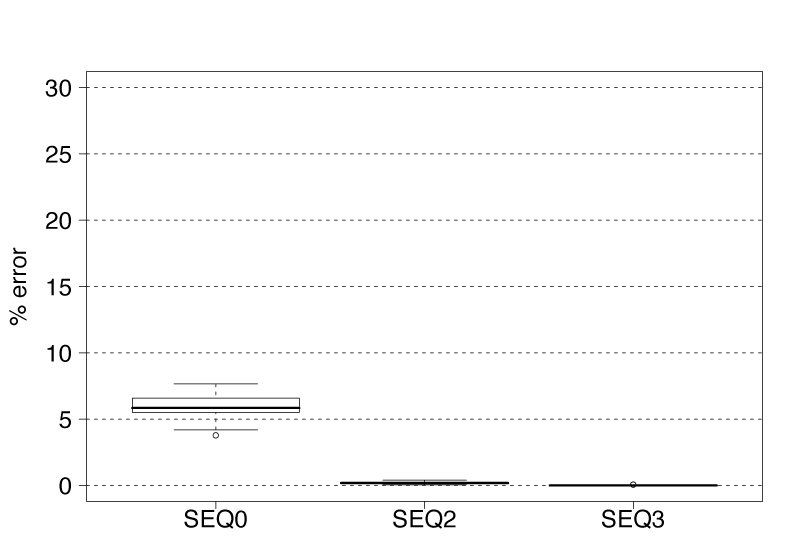
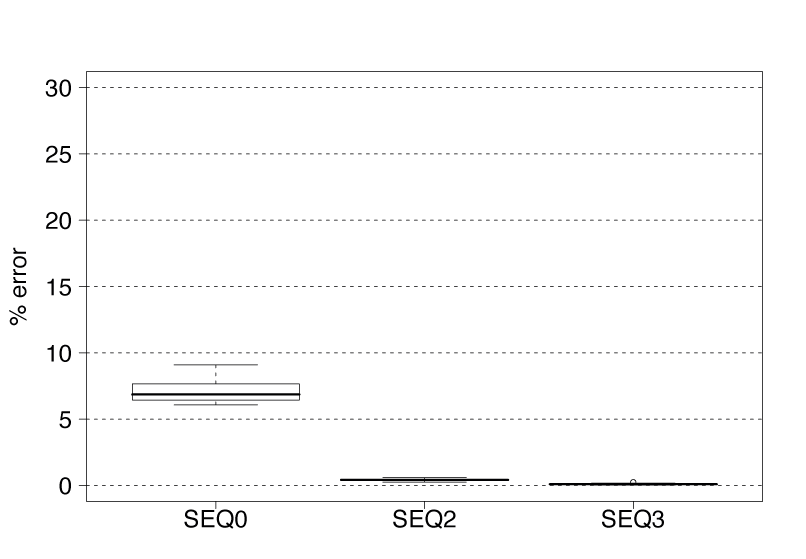
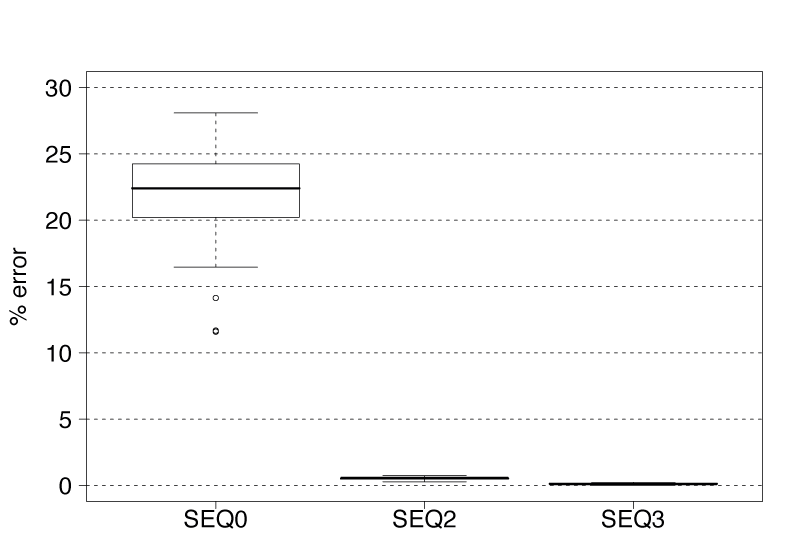
To assess the impact of the local search component on the final solution quality in our implementationof MMAS, we compare SEQ0, SEQ2, and SEQ3 on four TSPLIB instances: lin318, rat783, nrw1379, and pr2392. In order to obtain enough statistical evidence, 30 runs are performed for each algorithm on each instance. To conduct a fair comparison, due to the different time complexities of the three algorithms, we use a stopping criterion based on maximum CPU time, instead of a maximum number of iterations. The output of all the experiments for each algorithm is available in the following table:
| TSPLIB Instance | Algorithms |
|---|---|
lin318 |
SEQ0 (132KB), SEQ2 (32KB), SEQ3 (14KB) |
rat783 |
SEQ0 (257KB), SEQ2 (78KB), SEQ3 (40KB) |
nrw1379 |
SEQ0 (450KB), SEQ2 (171KB), SEQ3 (88KB) |
pr2392 |
SEQ0 (188KB), SEQ2 (256KB), SEQ3 (112KB) |
[1] "Instance lin318"
Pairwise comparisons using Wilcoxon rank sum test
SEQ0 SEQ2
SEQ2 3.6e-12 -
SEQ3 3.6e-12 0.33
P value adjustment method: holm
[1] "Instance rat783"
Pairwise comparisons using Wilcoxon rank sum test
SEQ0 SEQ2
SEQ2 3.0e-11 -
SEQ3 2.8e-11 2.8e-11
P value adjustment method: holm
[1] "Instance nrw1379"
Pairwise comparisons using Wilcoxon rank sum test
SEQ0 SEQ2
SEQ2 9e-11 -
SEQ3 9e-11 9e-11
P value adjustment method: holm
[1] "Instance pr2392"
Pairwise comparisons using Wilcoxon rank sum test
SEQ0 SEQ2
SEQ2 <2e-16 -
SEQ3 <2e-16 <2e-16
P value adjustment method: holm
| TSPLIB Instance | Boxplot of normalized results (click to download eps format) |
|---|---|
lin318 |
|
rat783 |
|
nrw1379 |
|
pr2392 |
|
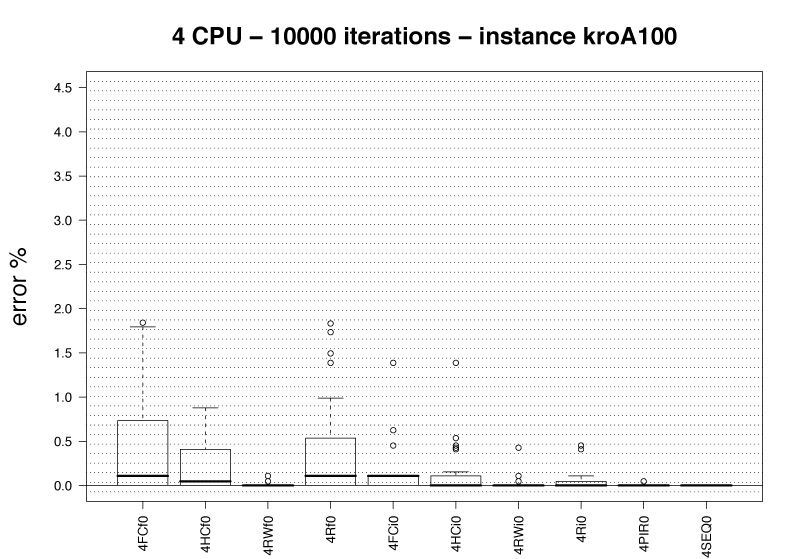
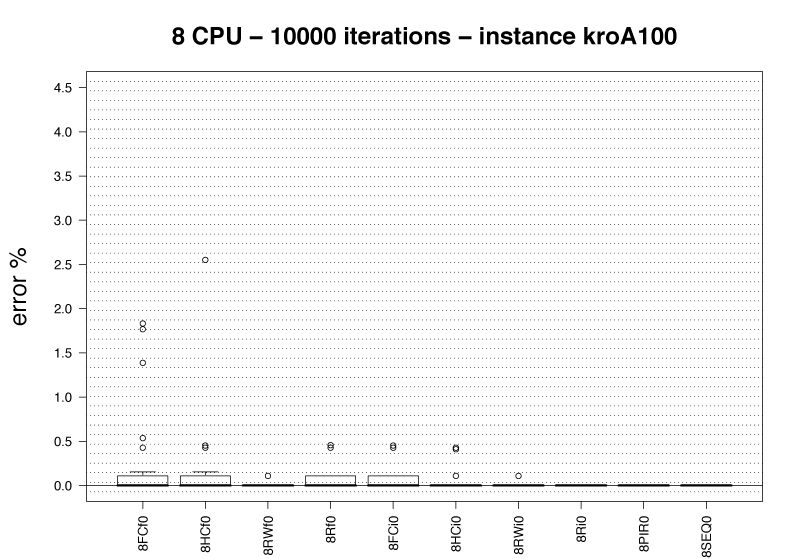
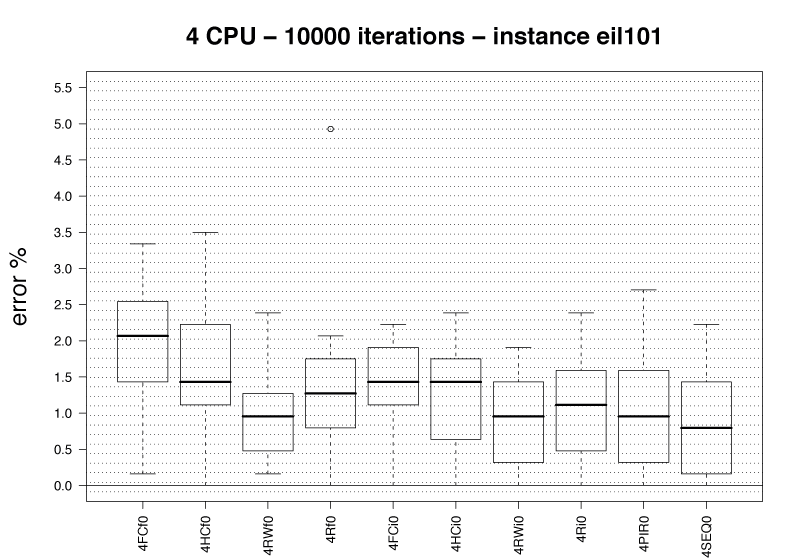
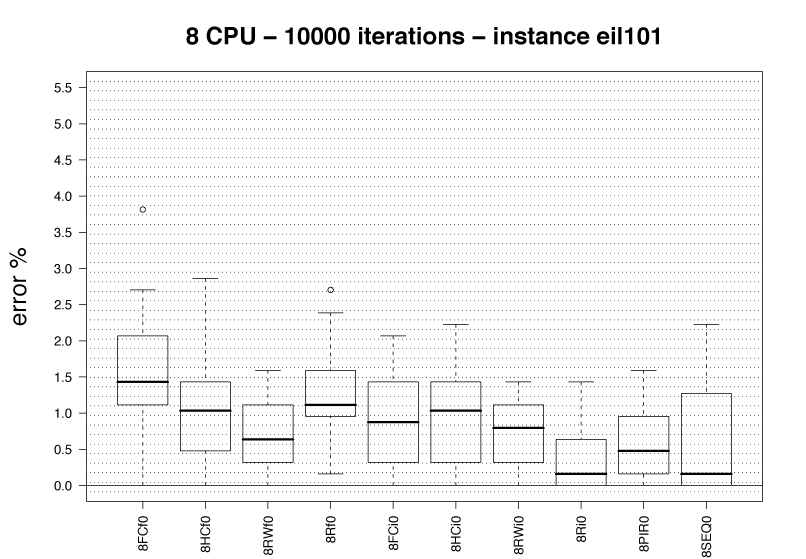
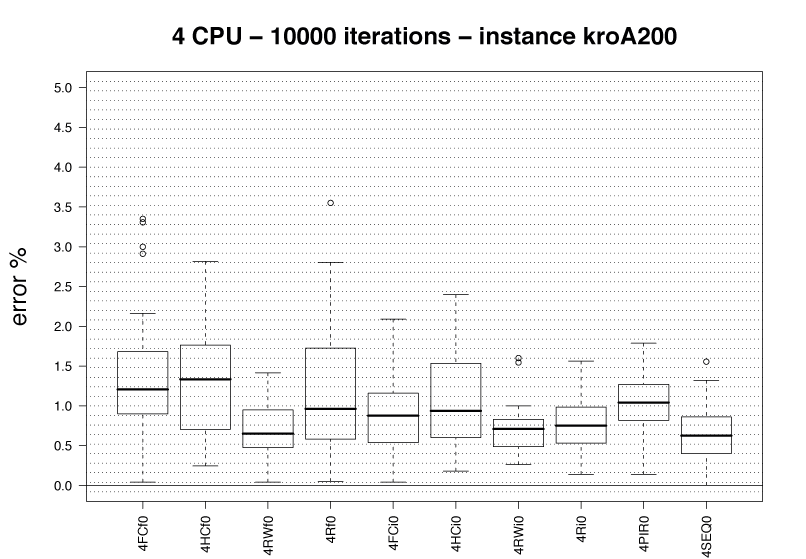
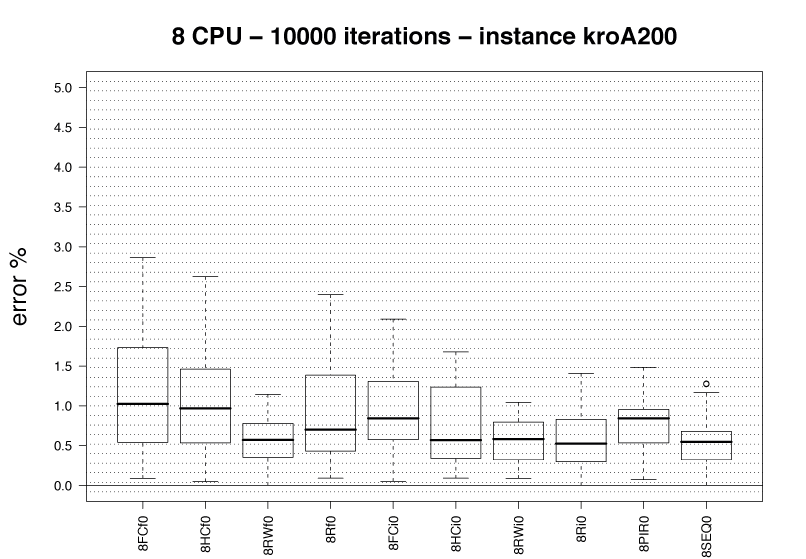
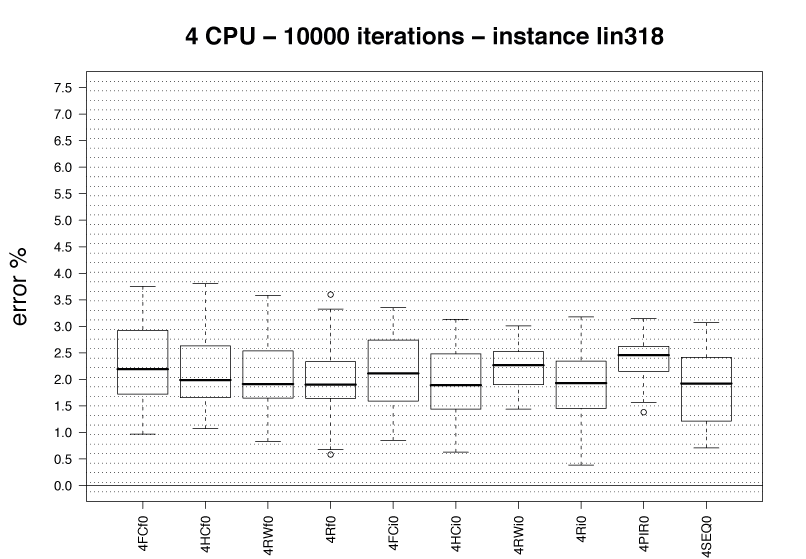
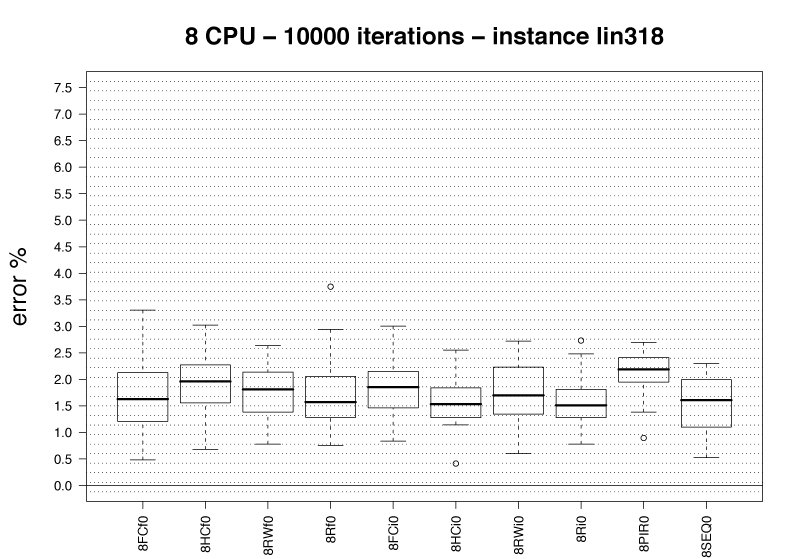
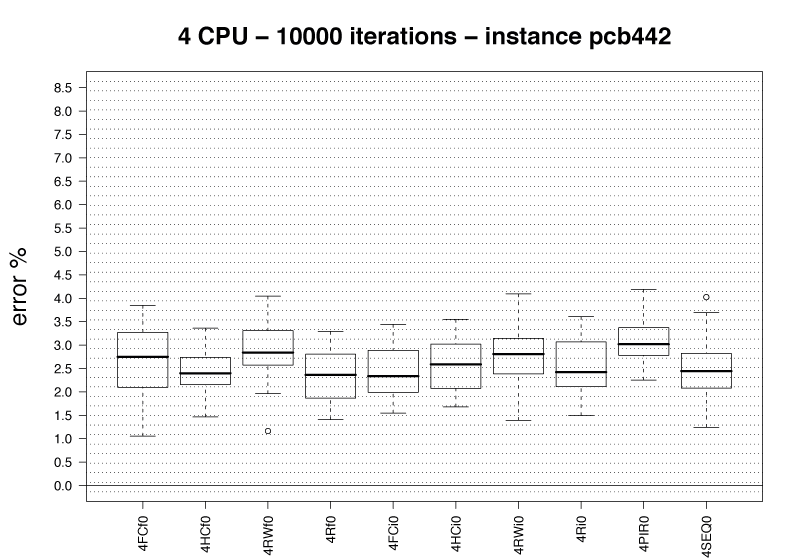
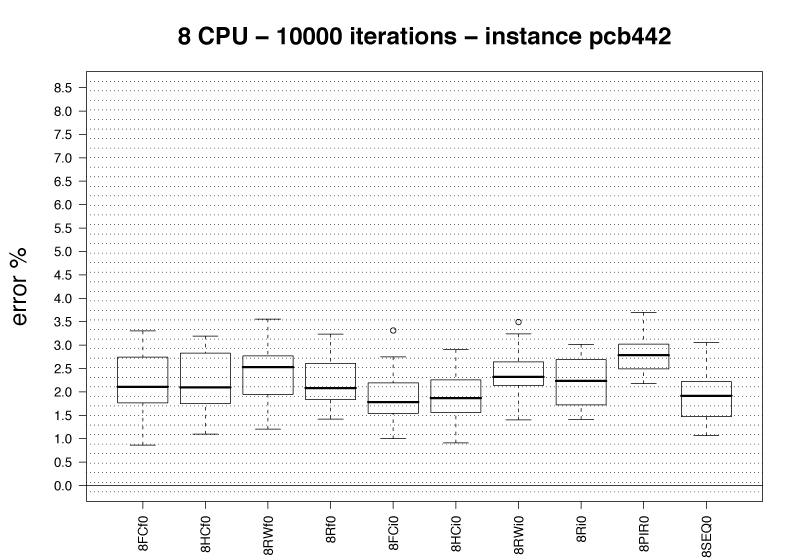
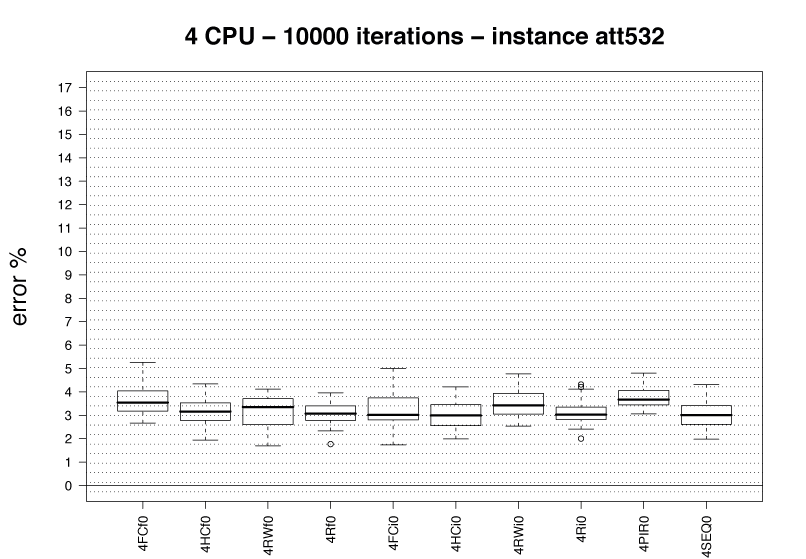
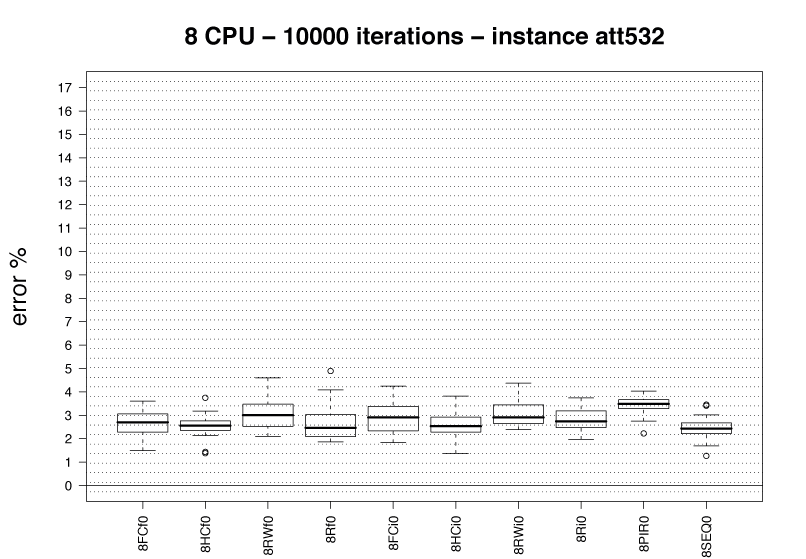
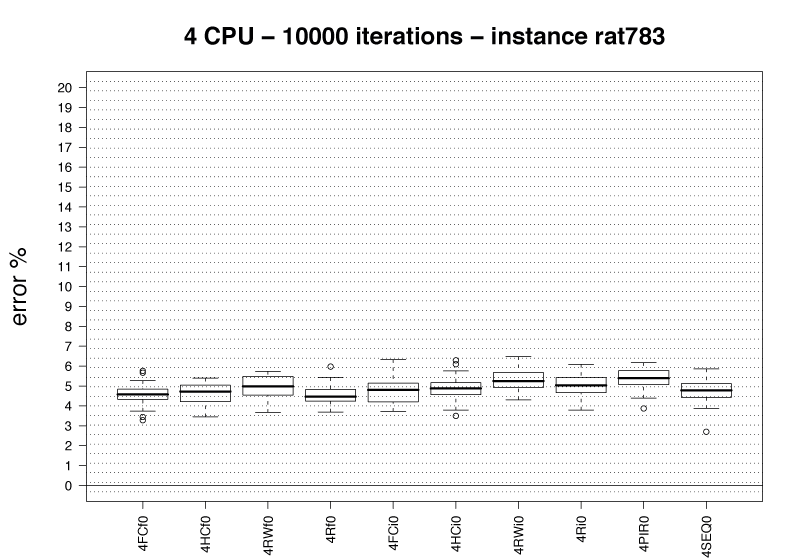
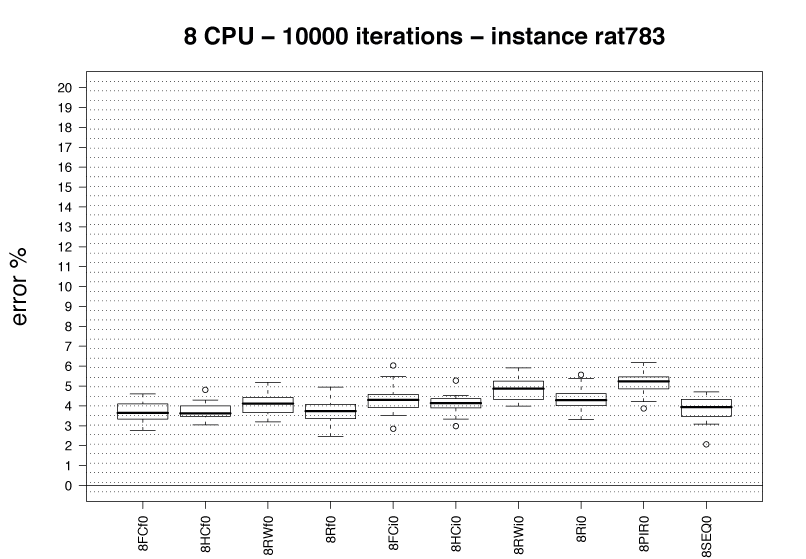
In a first set of experiments, we compare those treatments with the local search factor set to no local search. The experiments are carried out on 7 TSPLIB instances: kroA100, eil101, kroA200, lin318, pcb442, att532, and rat783. In order to We use a stopping criterion based on a maximum number of iterations: 10000. The output of all the experiments for each algorithm is available in the following table:
| TSPLIB Instance | Solution quality over iterations (click to download eps format) |
|||||||
|---|---|---|---|---|---|---|---|---|
| Algorithms | ||||||||
kroA100 |
4FCf0, 8FCf0 | 4HCf0, 8HCf0 | 4RWf0, 8RWf0 | 4Rf0, 8Rf0 | 4FCi0, 8FCi0 | 4HCi0, 8HCi0 | 4RWi0, 8RWi0 | 4Ri0, 8Ri0 |
eil101 |
4FCf0, 8FCf0 | 4HCf0, 8HCf0 | 4RWf0, 8RWf0 | 4Rf0, 8Rf0 | 4FCi0, 8FCi0 | 4HCi0, 8HCi0 | 4RWi0, 8RWi0 | 4Ri0, 8Ri0 |
kroA200 |
4FCf0, 8FCf0 | 4HCf0, 8HCf0 | 4RWf0, 8RWf0 | 4Rf0, 8Rf0 | 4FCi0, 8FCi0 | 4HCi0, 8HCi0 | 4RWi0, 8RWi0 | 4Ri0, 8Ri0 |
lin318 |
4FCf0, 8FCf0 | 4HCf0, 8HCf0 | 4RWf0, 8RWf0 | 4Rf0, 8Rf0 | 4FCi0, 8FCi0 | 4HCi0, 8HCi0 | 4RWi0, 8RWi0 | 4Ri0, 8Ri0 |
pcb442 |
4FCf0, 8FCf0 | 4HCf0, 8HCf0 | 4RWf0, 8RWf0 | 4Rf0, 8Rf0 | 4FCi0, 8FCi0 | 4HCi0, 8HCi0 | 4RWi0, 8RWi0 | 4Ri0, 8Ri0 |
att532 |
4FCf0, 8FCf0 | 4HCf0, 8HCf0 | 4RWf0, 8RWf0 | 4Rf0, 8Rf0 | 4FCi0, 8FCi0 | 4HCi0, 8HCi0 | 4RWi0, 8RWi0 | 4Ri0, 8Ri0 |
rat783 |
4FCf0, 8FCf0 | 4HCf0, 8HCf0 | 4RWf0, 8RWf0 | 4Rf0, 8Rf0 | 4FCi0, 8FCi0 | 4HCi0, 8HCi0 | 4RWi0, 8RWi0 | 4Ri0, 8Ri0 |
| TSPLIB Instance | Boxplot of normalized results | Boxplot of normalized results |
|---|---|---|
kroA100 |
 |
 |
eil101 |
 |
 |
kroA200 |
 |
 |
lin318 |
 |
 |
pcb442 |
 |
 |
att532 |
 |
 |
rat783 |
 |
 |
| TSPLIB Instance | ANOVAs |
|---|---|
kroA100 |
Numerical values, Graphics |
eil101 |
Numerical values, Graphics |
kroA200 |
Numerical values, Graphics |
lin318 |
Numerical values, Graphics |
pcb442 |
Numerical values, Graphics |
att532 |
Numerical values, Graphics |
rat783 |
Numerical values, Graphics |
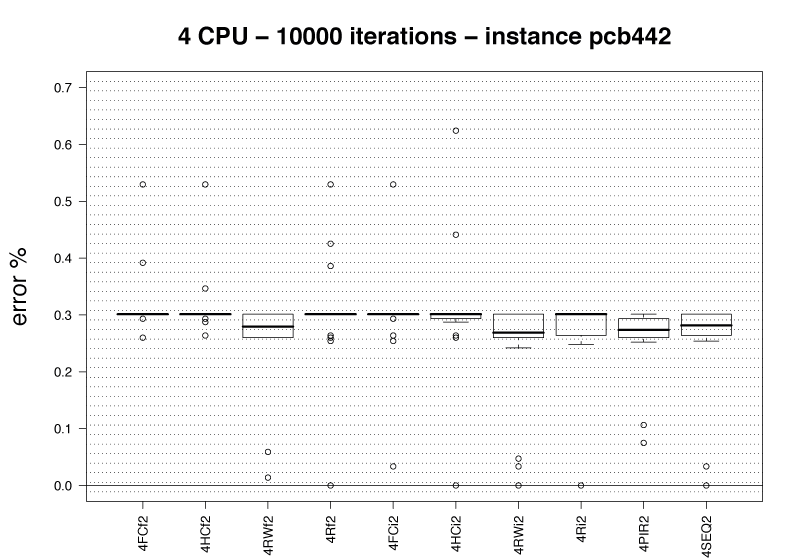
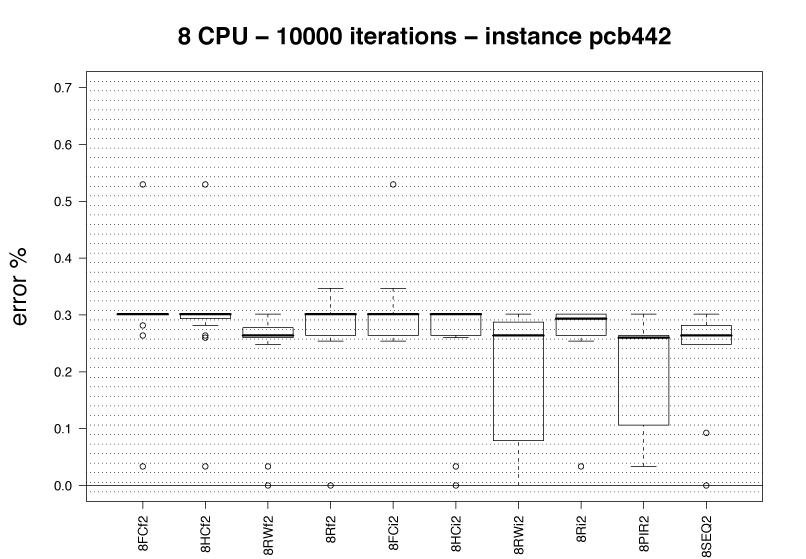
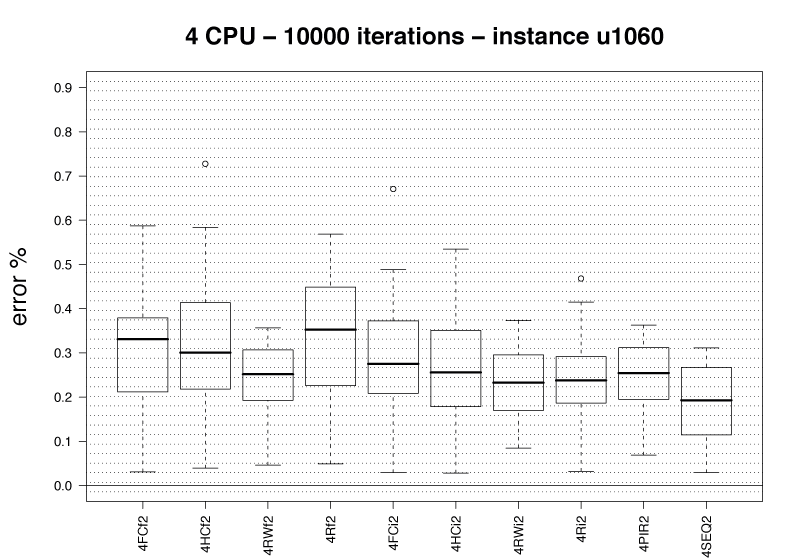
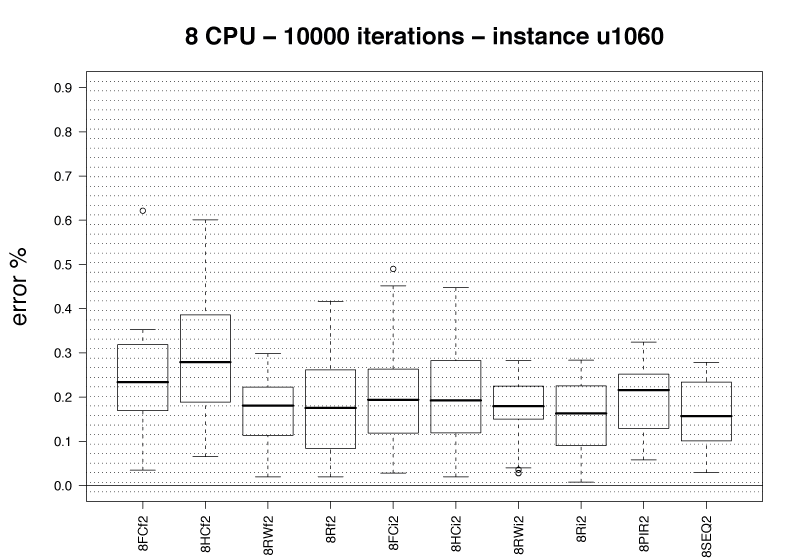
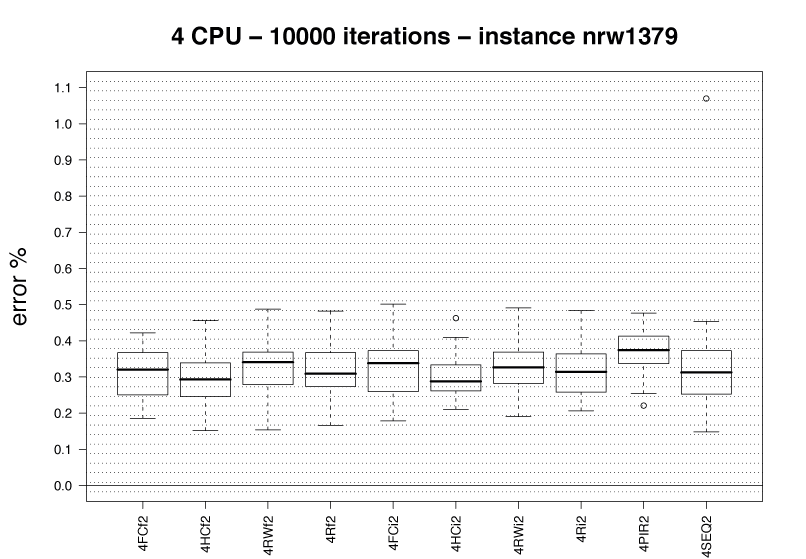
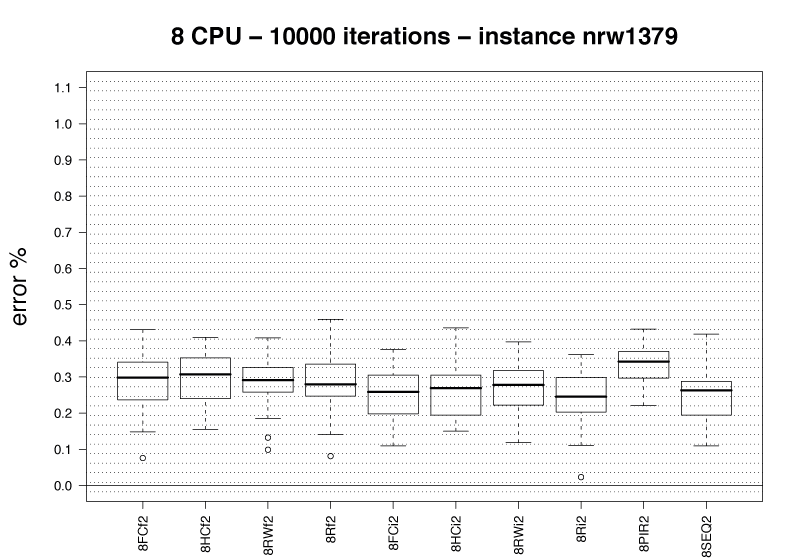
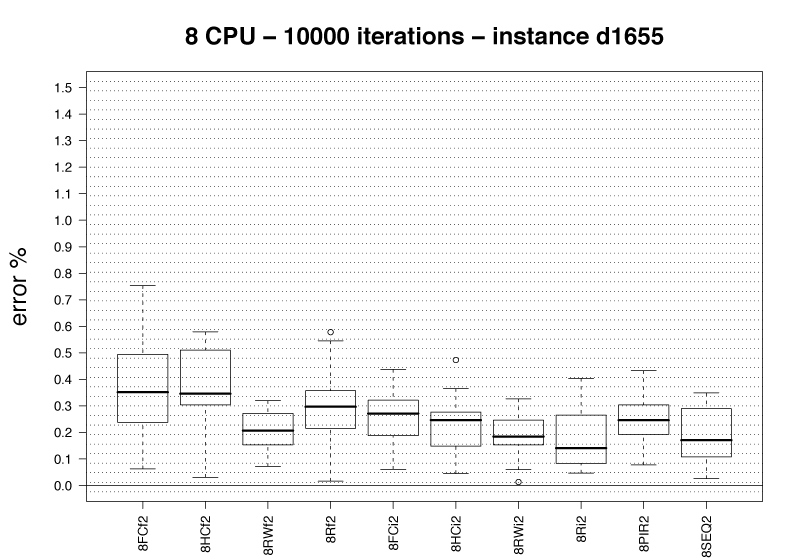
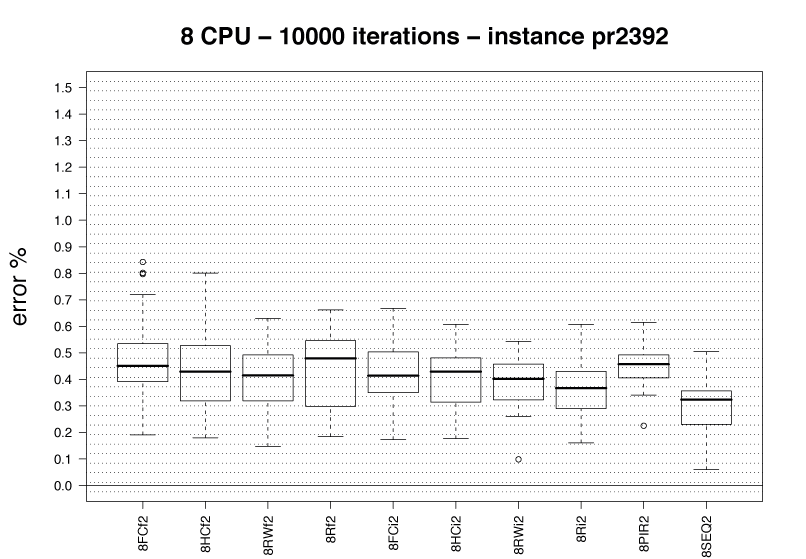
In a second set of experiments, we compare those treatments with the local search factor set to 2-opt local search. The experiments are carried out on 7 TSPLIB instances: pcb442, att532, rat783, u1060, d1655, and pr2392. We use a stopping criterion based on a maximum number of iterations: 10000. The output of all the experiments for each algorithm is available in the following table:
| TSPLIB Instance | Normalized results over iterations (click to download eps format) |
|||||||
|---|---|---|---|---|---|---|---|---|
| Algorithms | ||||||||
pcb442 |
4FCf2, 8FCf2 | 4HCf2, 8HCf2 | 4RWf2, 8RWf2 | 4Rf2, 8Rf2 | 4FCi2, 8FCi2 | 4HCi2, 8HCi2 | 4RWi2, 8RWi2 | 4Ri2, 8Ri2 |
att532 |
4FCf2, 8FCf2 | 4HCf2, 8HCf2 | 4RWf2, 8RWf2 | 4Rf2, 8Rf2 | 4FCi2, 8FCi2 | 4HCi2, 8HCi2 | 4RWi2, 8RWi2 | 4Ri2, 8Ri2 |
rat783 |
4FCf2, 8FCf2 | 4HCf2, 8HCf2 | 4RWf2, 8RWf2 | 4Rf2, 8Rf2 | 4FCi2, 8FCi2 | 4HCi2, 8HCi2 | 4RWi2, 8RWi2 | 4Ri2, 8Ri2 |
u1060 |
4FCf2, 8FCf2 | 4HCf2, 8HCf2 | 4RWf2, 8RWf2 | 4Rf2, 8Rf2 | 4FCi2, 8FCi2 | 4HCi2, 8HCi2 | 4RWi2, 8RWi2 | 4Ri2, 8Ri2 |
nrw1379 |
4FCf2, 8FCf2 | 4HCf2, 8HCf2 | 4RWf2, 8RWf2 | 4Rf2, 8Rf2 | 4FCi2, 8FCi2 | 4HCi2, 8HCi2 | 4RWi2, 8RWi2 | 4Ri2, 8Ri2 |
d1655 |
4FCf2, 8FCf2 | 4HCf2, 8HCf2 | 4RWf2, 8RWf2 | 4Rf2, 8Rf2 | 4FCi2, 8FCi2 | 4HCi2, 8HCi2 | 4RWi2, 8RWi2 | 4Ri2, 8Ri2 |
pr2392 |
4FCf2, 8FCf2 | 4HCf2, 8HCf2 | 4RWf2, 8RWf2 | 4Rf2, 8Rf2 | 4FCi2, 8FCi2 | 4HCi2, 8HCi2 | 4RWi2, 8RWi2 | 4Ri2, 8Ri2 |
| TSPLIB Instance | Boxplot of normalized results | Boxplot of normalized results |
|---|---|---|
pcb442 |
 |
 |
att532 |
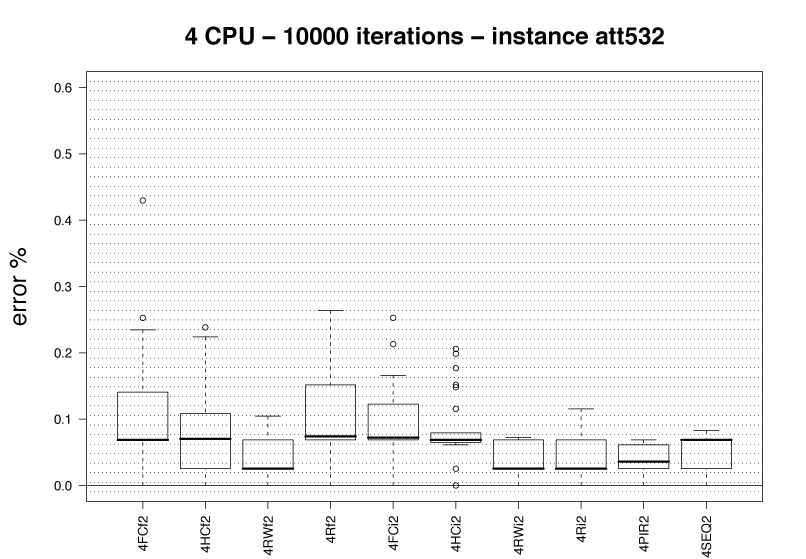 |
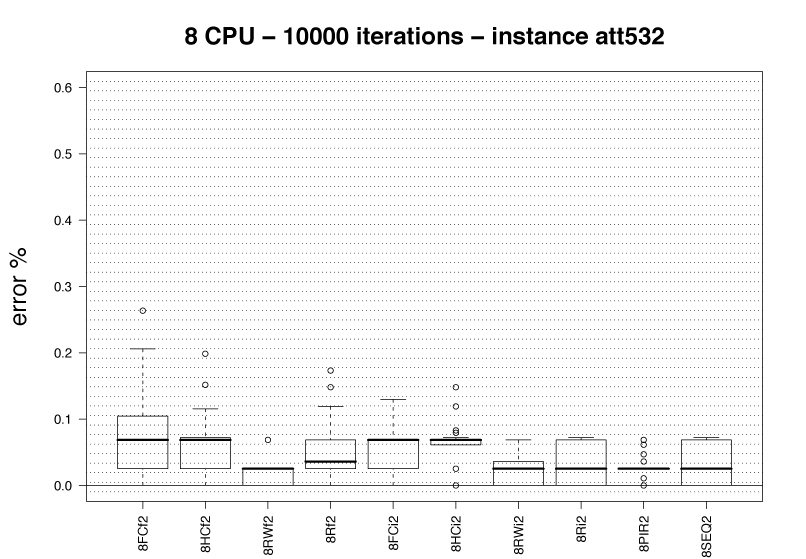 |
rat783 |
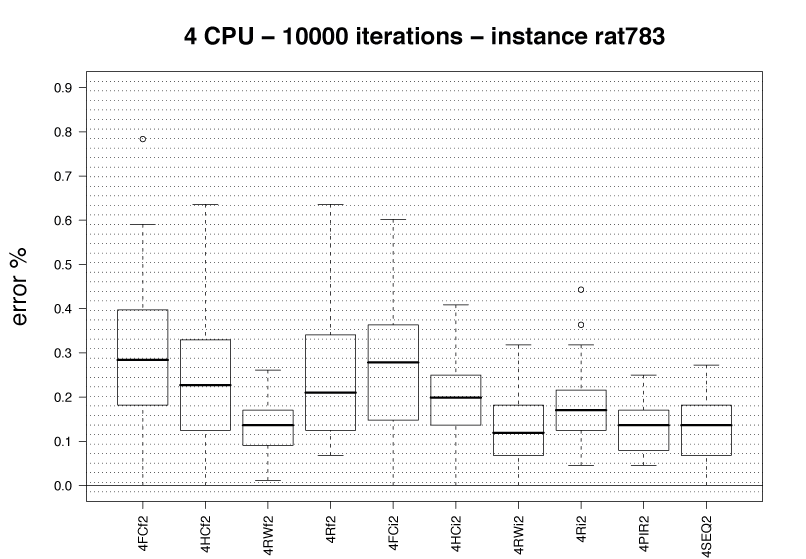 |
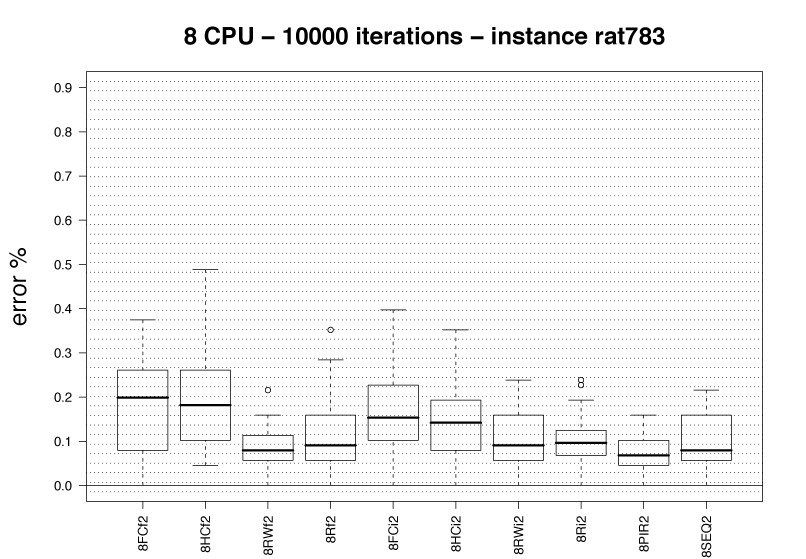 |
u1060 |
 |
 |
nrw1379 |
 |
 |
d1655 |
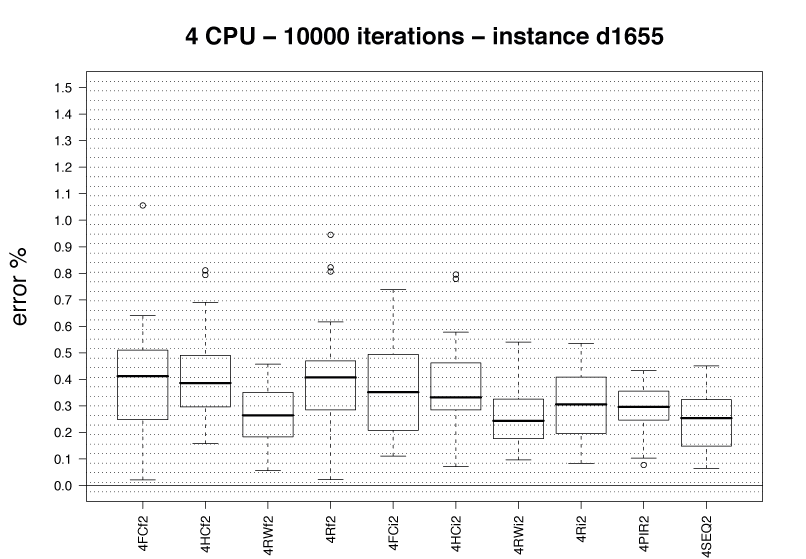 |
 |
pr2392 |
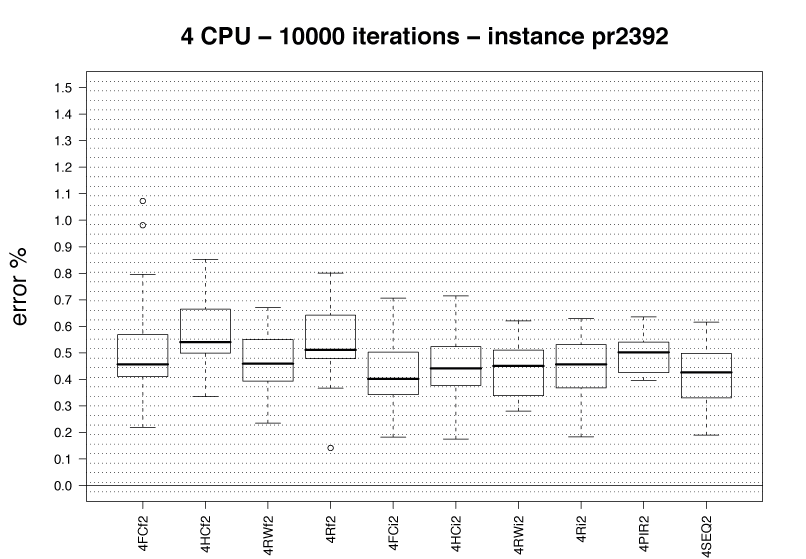 |
 |
| TSPLIB Instance | ANOVAs |
|---|---|
pcb442 |
Numerical values, Graphics |
att532 |
Numerical values, Graphics |
rat783 |
Numerical values, Graphics |
u1060 |
Numerical values, Graphics |
nrw1379 |
Numerical values, Graphics |
d1655 |
Numerical values, Graphics |
pr2392 |
Numerical values, Graphics |
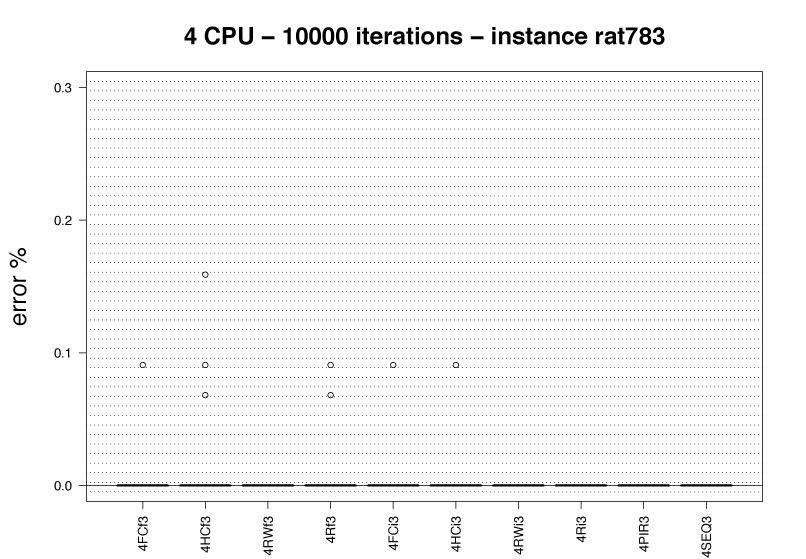
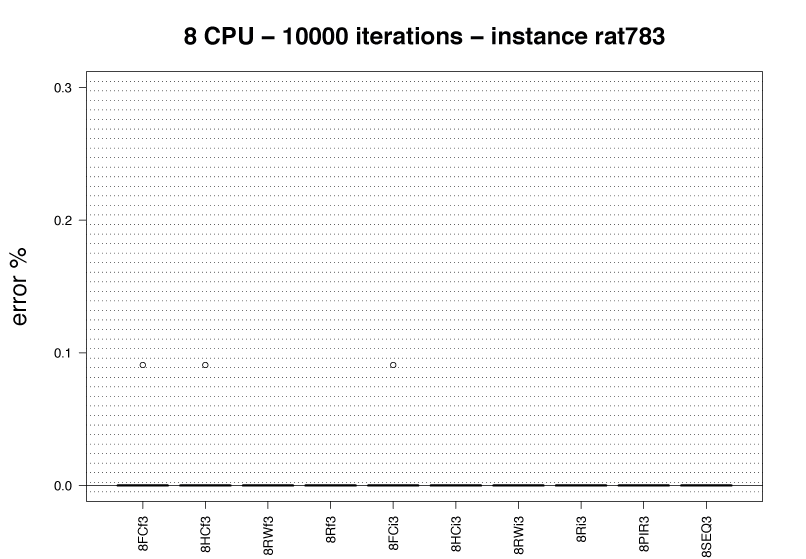
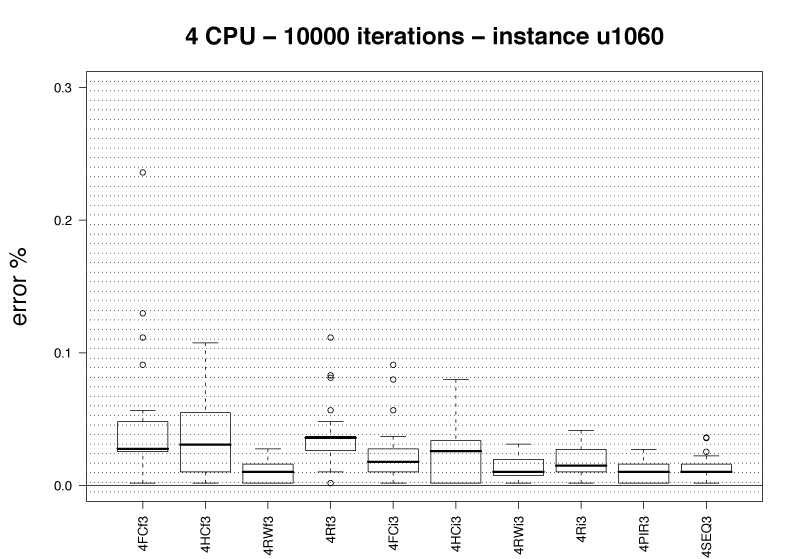
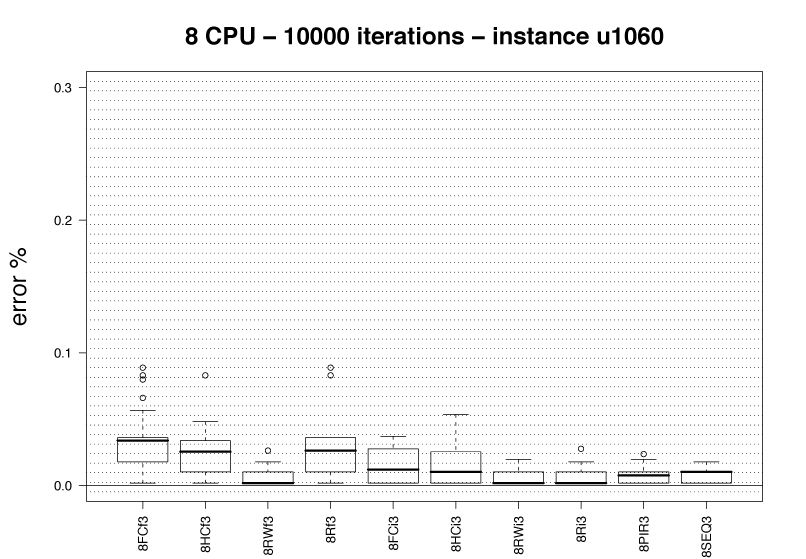
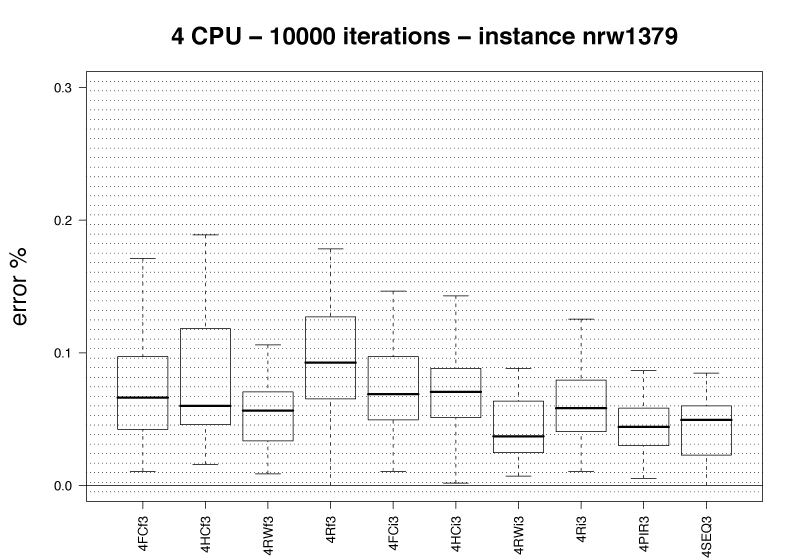
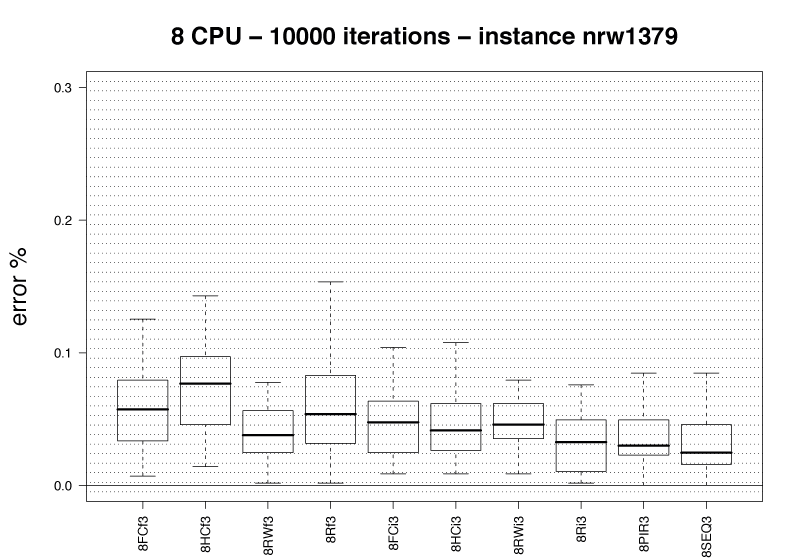
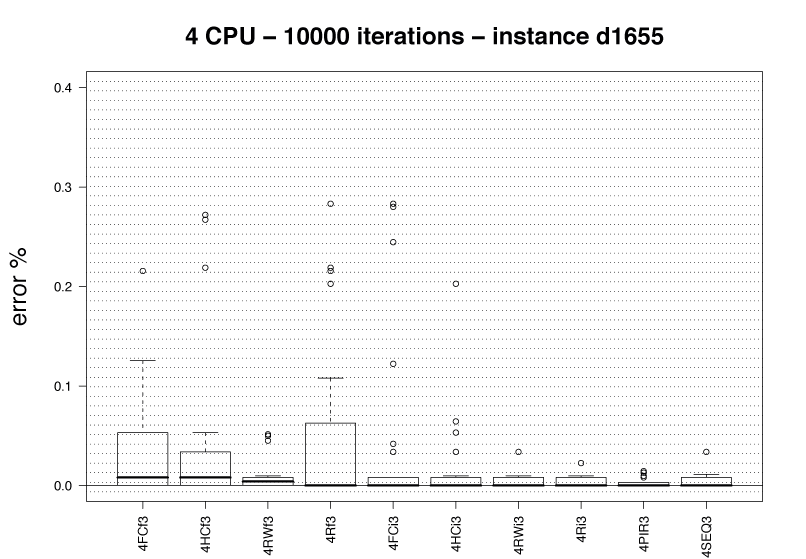
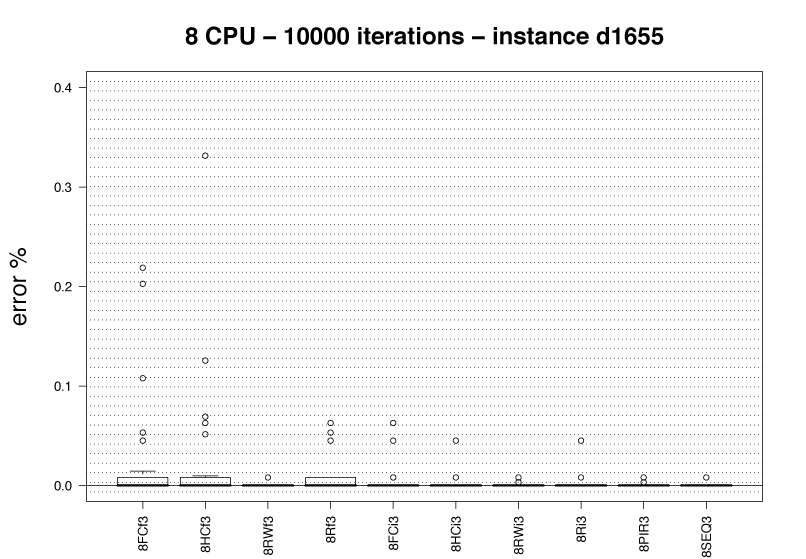
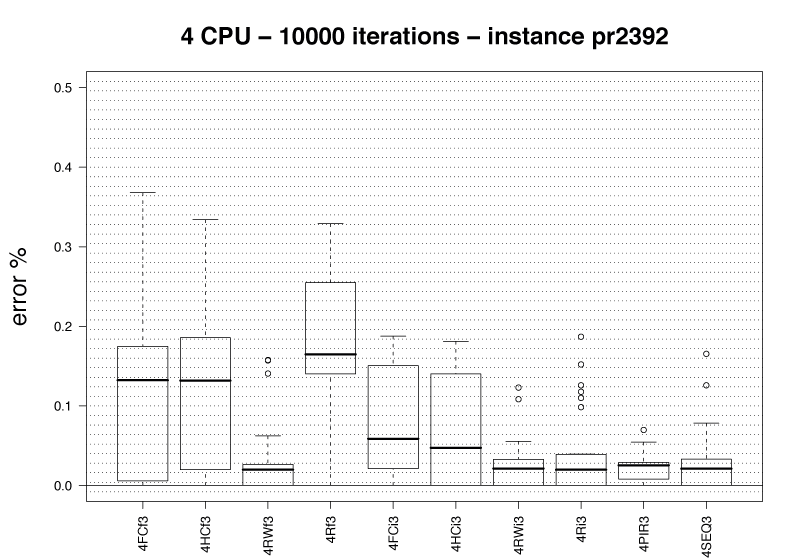
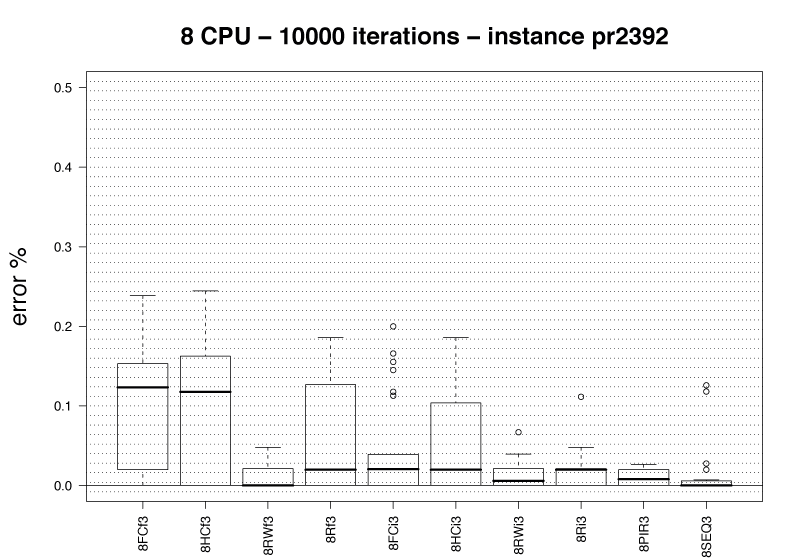
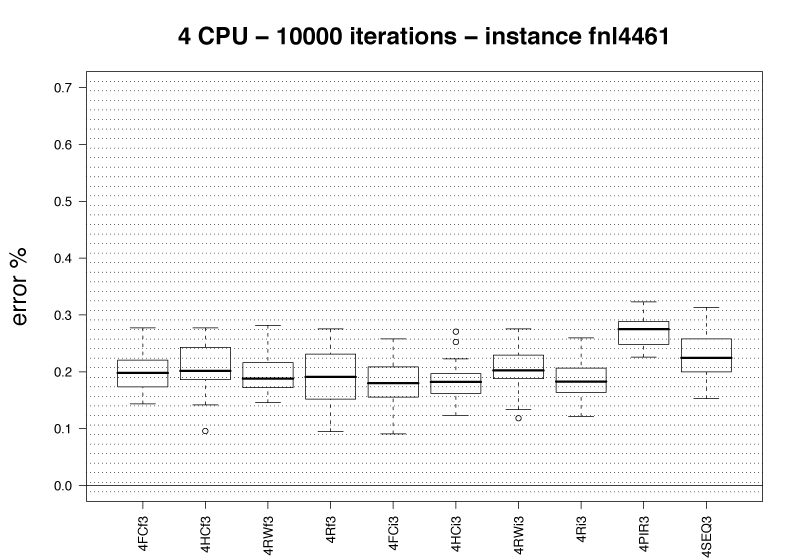
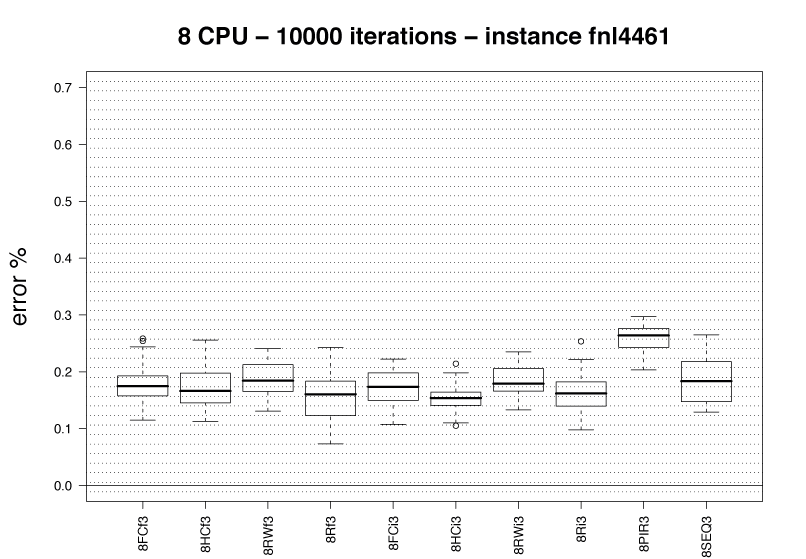
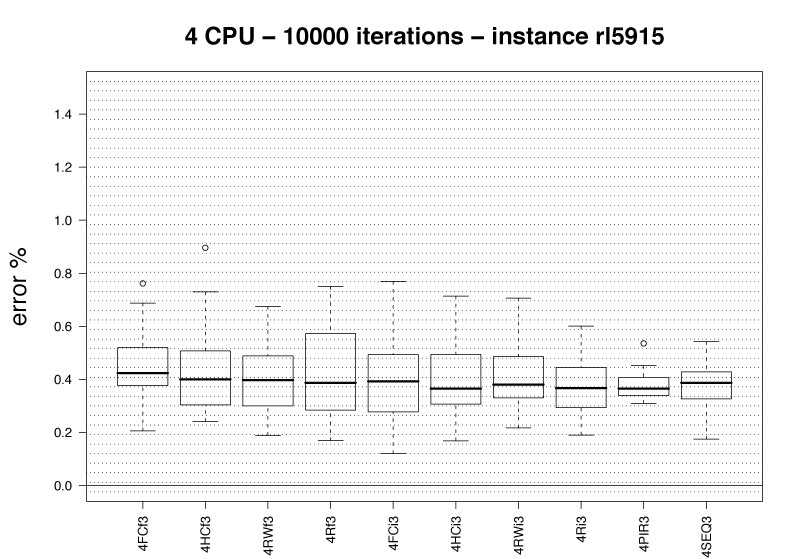
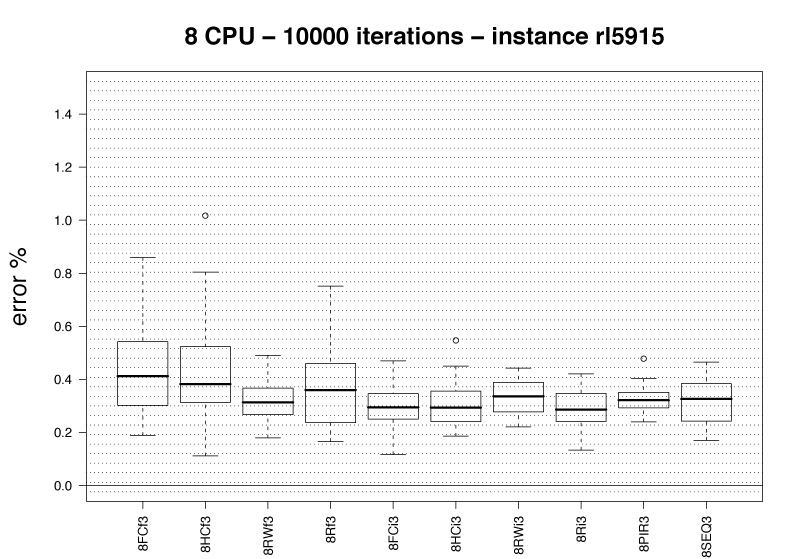
In a third set of experiments, we compare those treatments with the local search factor set to 3-opt local search. The experiments are carried out on 7 TSPLIB instances: rat783, u1060, nrw1379, d1655, pr2392, fnl4461, and rl5915. We use a stopping criterion based on a maximum number of iterations: 10000. The output of all the experiments for each algorithm is available in the following table:
| TSPLIB Instance | Normalized results over iterations (click to download eps format) |
|||||||
|---|---|---|---|---|---|---|---|---|
| Algorithms | ||||||||
rat783 |
4FCf3, 8FCf3 | 4HCf3, 8HCf3 | 4RWf3, 8RWf3 | 4Rf3, 8Rf3 | 4FCi3, 8FCi3 | 4HCi3, 8HCi3 | 4RWi3, 8RWi3 | 4Ri3, 8Ri3 |
u1060 |
4FCf3, 8FCf3 | 4HCf3, 8HCf3 | 4RWf3, 8RWf3 | 4Rf3, 8Rf3 | 4FCi3, 8FCi3 | 4HCi3, 8HCi3 | 4RWi3, 8RWi3 | 4Ri3, 8Ri3 |
nrw1379 |
4FCf3, 8FCf3 | 4HCf3, 8HCf3 | 4RWf3, 8RWf3 | 4Rf3, 8Rf3 | 4FCi3, 8FCi3 | 4HCi3, 8HCi3 | 4RWi3, 8RWi3 | 4Ri3, 8Ri3 |
d1655 |
4FCf3, 8FCf3 | 4HCf3, 8HCf3 | 4RWf3, 8RWf3 | 4Rf3, 8Rf3 | 4FCi3, 8FCi3 | 4HCi3, 8HCi3 | 4RWi3, 8RWi3 | 4Ri3, 8Ri3 |
pr2392 |
4FCf3, 8FCf3 | 4HCf3, 8HCf3 | 4RWf3, 8RWf3 | 4Rf3, 8Rf3 | 4FCi3, 8FCi3 | 4HCi3, 8HCi3 | 4RWi3, 8RWi3 | 4Ri3, 8Ri3 |
fnl4461 |
4FCf3, 8FCf3 | 4HCf3, 8HCf3 | 4RWf3, 8RWf3 | 4Rf3, 8Rf3 | 4FCi3, 8FCi3 | 4HCi3, 8HCi3 | 4RWi3, 8RWi3 | 4Ri3, 8Ri3 |
rl5915 |
4FCf3, 8FCf3 | 4HCf3, 8HCf3 | 4RWf3, 8RWf3 | 4Rf3, 8Rf3 | 4FCi3, 8FCi3 | 4HCi3, 8HCi3 | 4RWi3, 8RWi3 | 4Ri3, 8Ri3 |
| TSPLIB Instance | Boxplot of normalized results | Boxplot of normalized results |
|---|---|---|
rat783 |
 |
 |
u1060 |
 |
 |
nrw1379 |
 |
 |
d1655 |
 |
 |
pr2392 |
 |
 |
fnl4461 |
 |
 |
rl5915 |
 |
 |
| TSPLIB Instance | ANOVAs |
|---|---|
rat783 |
Numerical values, Graphics |
u1060 |
Numerical values, Graphics |
nrw1379 |
Numerical values, Graphics |
d1655 |
Numerical values, Graphics |
pr2392 |
Numerical values, Graphics |
fnl4461 |
Numerical values, Graphics |
rl5915 |
Numerical values, Graphics |
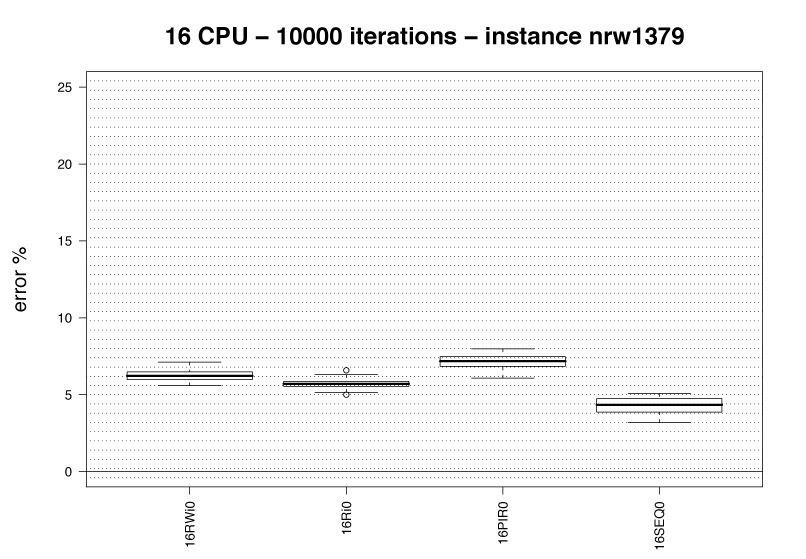
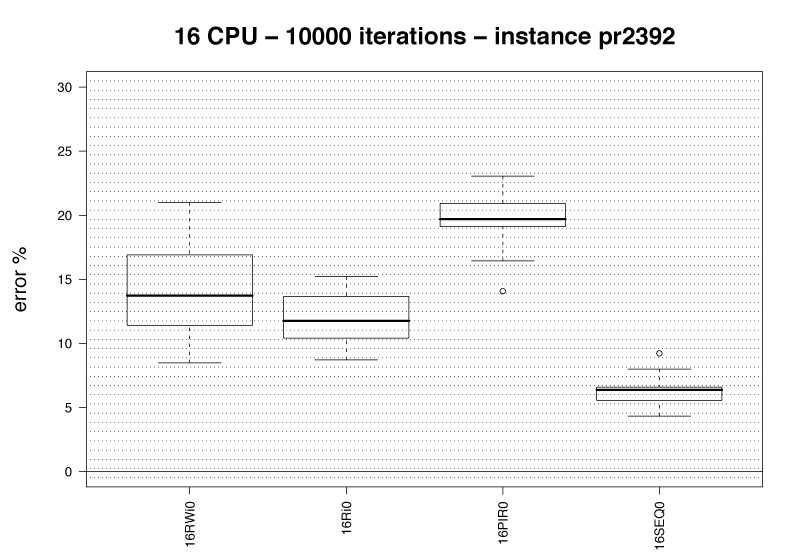
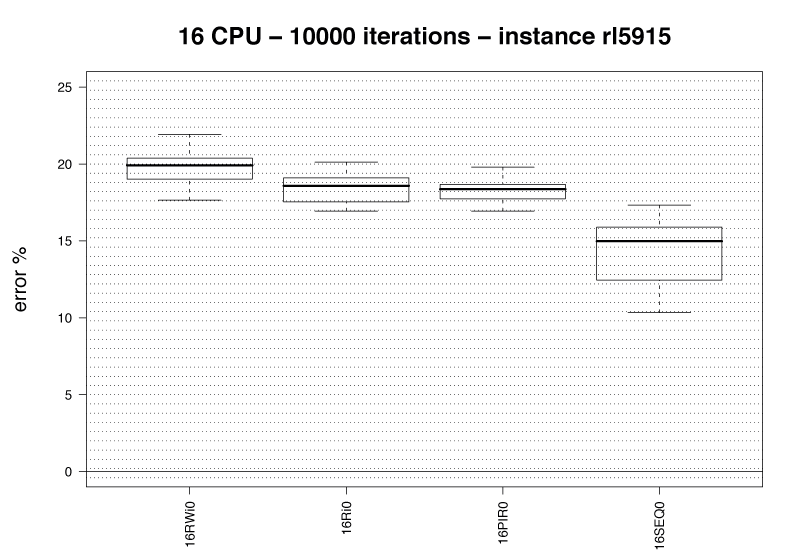
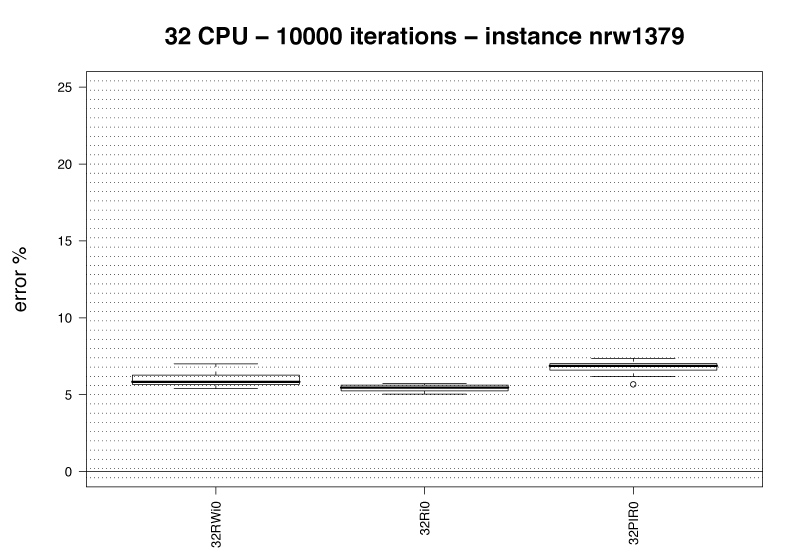
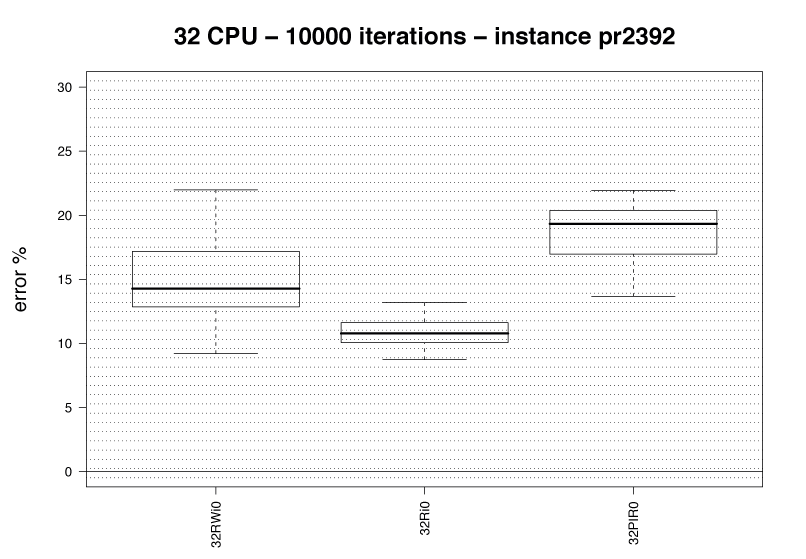
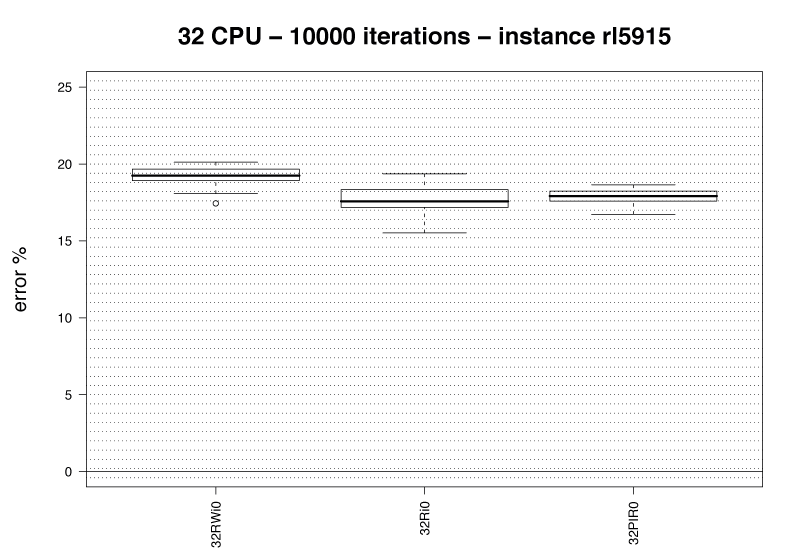
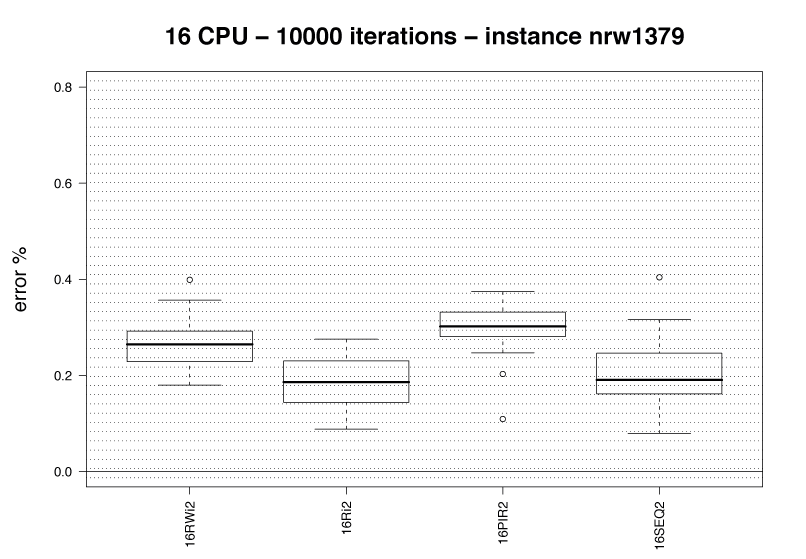
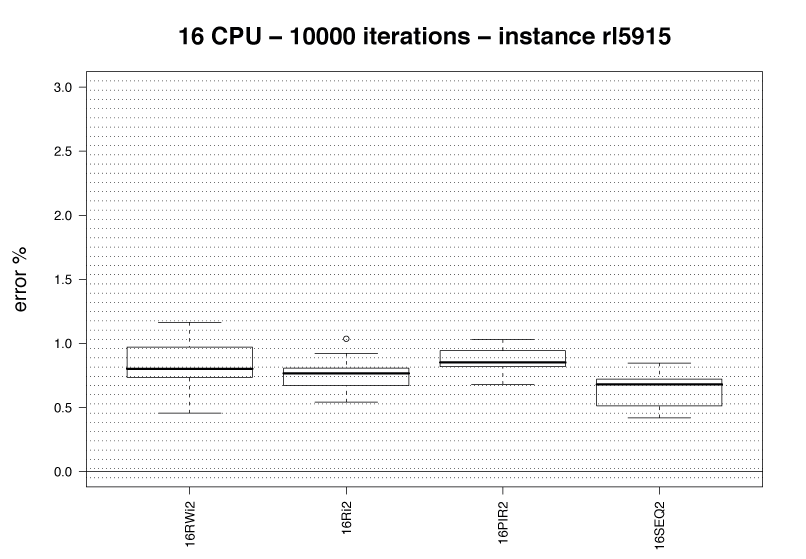
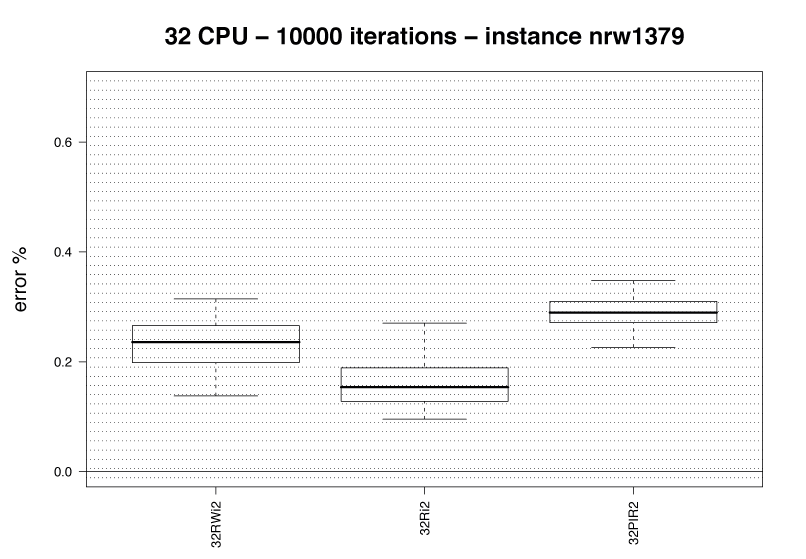
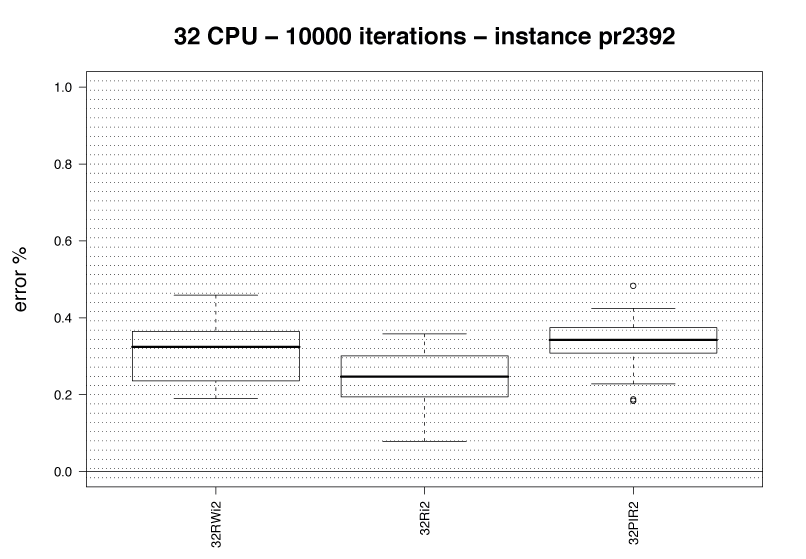
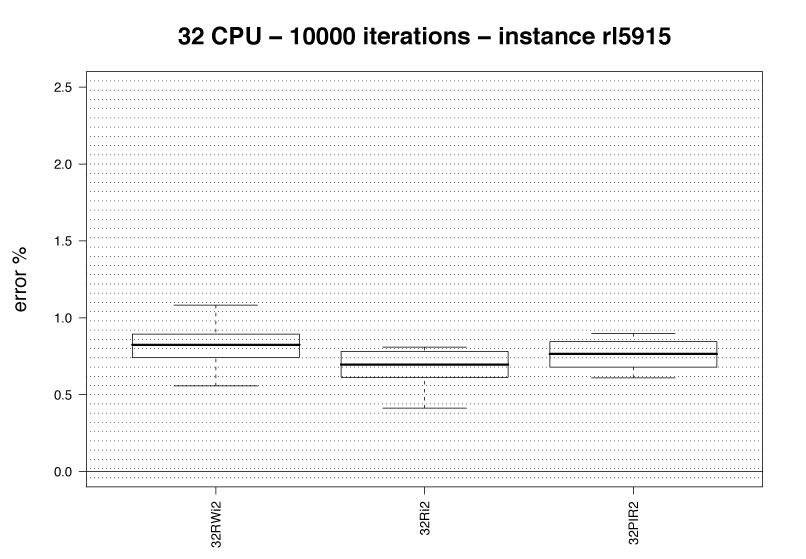
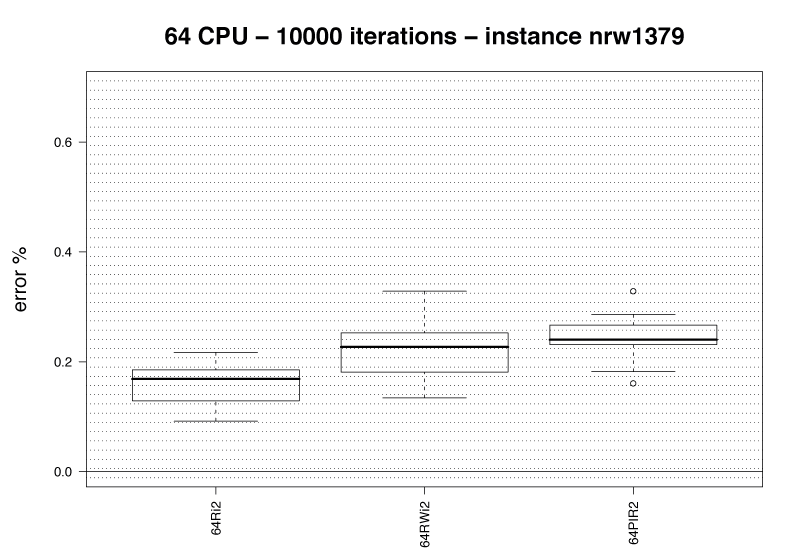
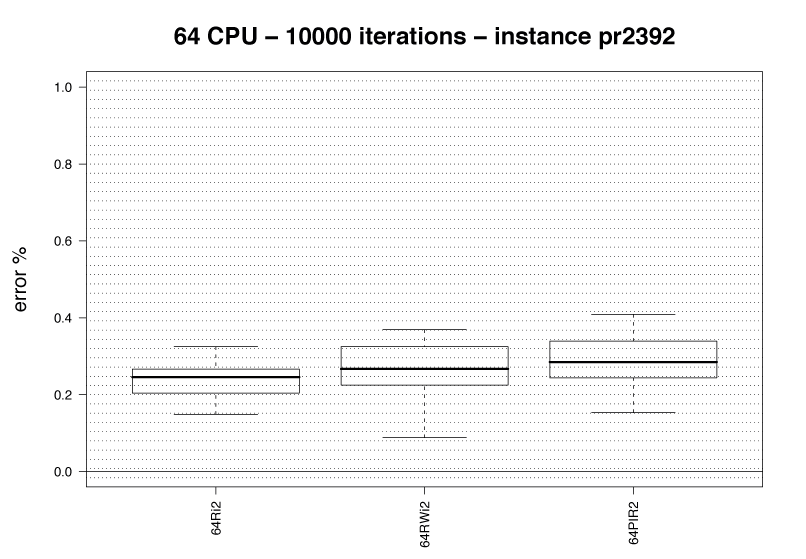
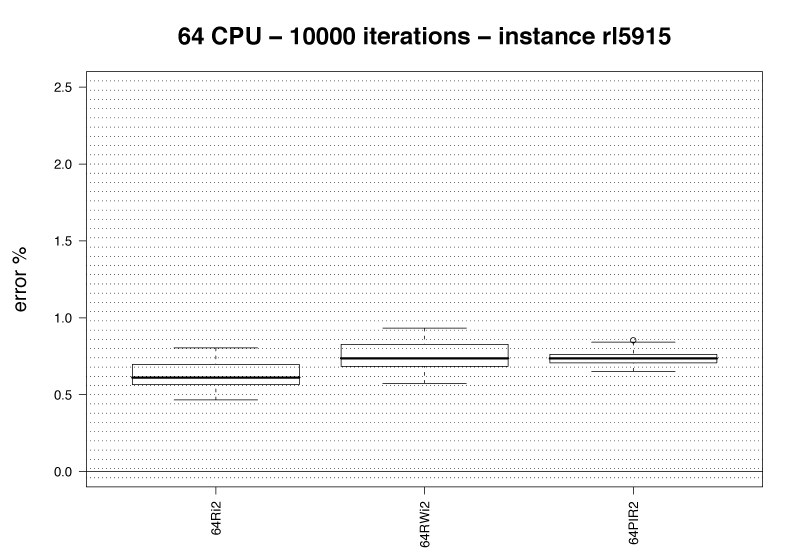
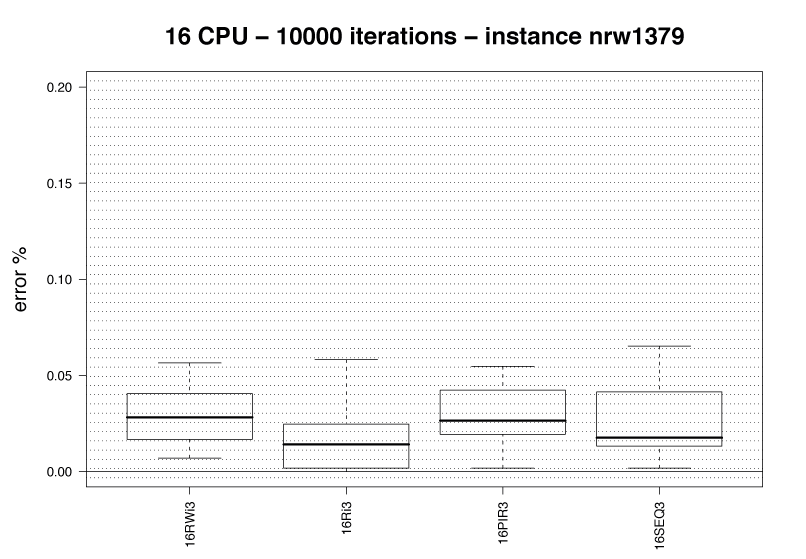
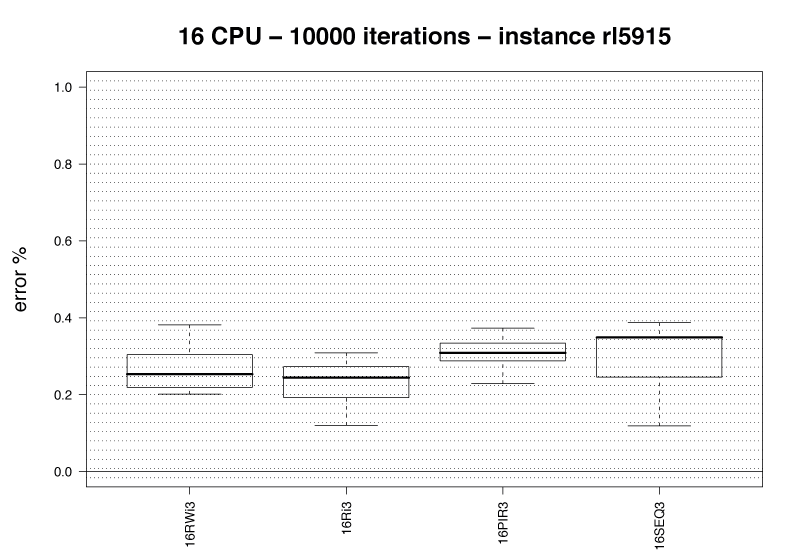
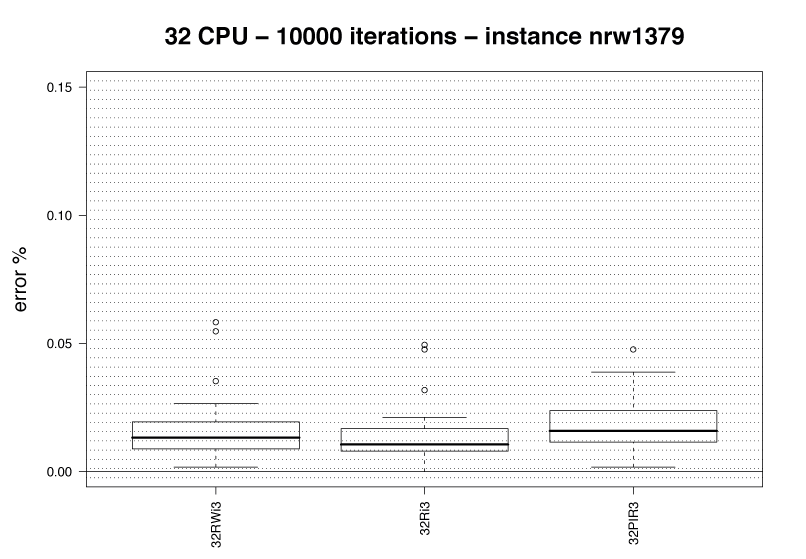
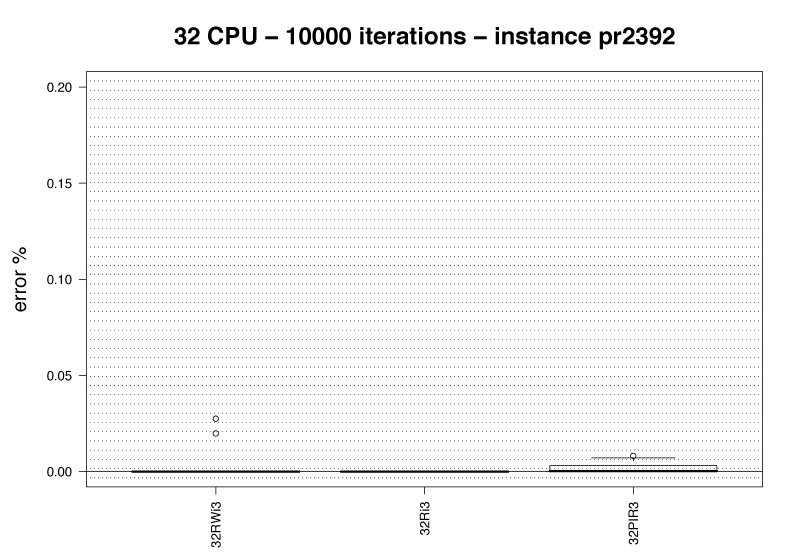
In a fourth set of experiments, the most successful policies identified previously are tested with three more levels for the factor number of colonies: 16, 32, and 64, respectively.
From the previous analyses we concluded that the overall better communication strategies are the replace-worst and the unidirectional ring, in both the cases with and without local search component. We found also that the increasing-frequency schedule has beneficial effects that tend to grow with increasing number of colonies. This fourth set of experiments is carried out on 3 TSPLIB instances: nrw1379, pr2392, and rl5915, performing 20 runs of 10000 iterations each. The output of all the experiments for each algorithm is available in the following table:
CPUs |
TSPLIB instance |
Algorithms |
|||
|---|---|---|---|---|---|
xRi0 |
xRWi0 |
xPIR0 |
xSEQ0 |
||
16 |
nrw1379 |
||||
pr2392 |
|||||
rl5915 |
|||||
32 |
nrw1379 |
N.A. |
|||
pr2392 |
N.A. |
||||
rl5915 |
N.A. |
||||
64 |
nrw1379 |
N.A. |
|||
pr2392 |
N.A. |
||||
rl5915 |
N.A. |
||||
| local search | CPUs | TSPLIB instance |
Boxplot of normalized results (click to download eps format) |
|---|---|---|---|
| no local search | 16 | nrw1379 |
 |
pr2392 |
 |
||
rl5915 |
 |
||
| no local search | 32 | nrw1379 |
 |
pr2392 |
 |
||
rl5915 |
 |
||
| no local search | 64 | nrw1379 |
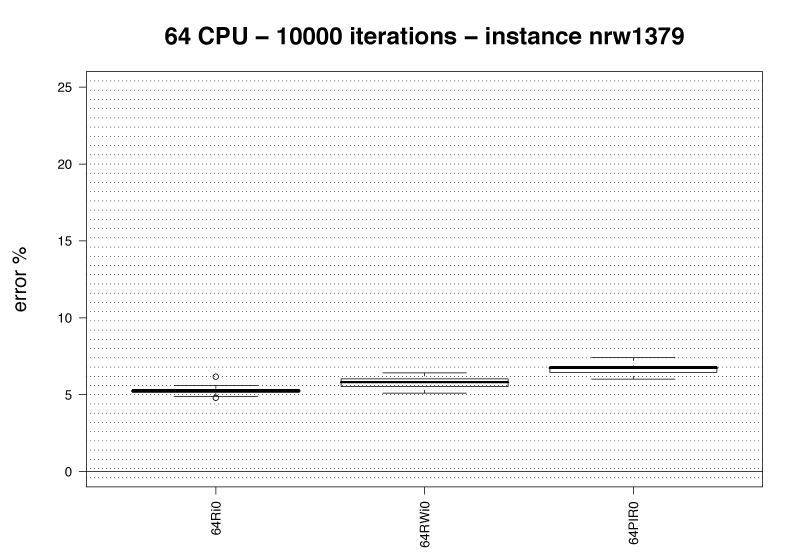 |
pr2392 |
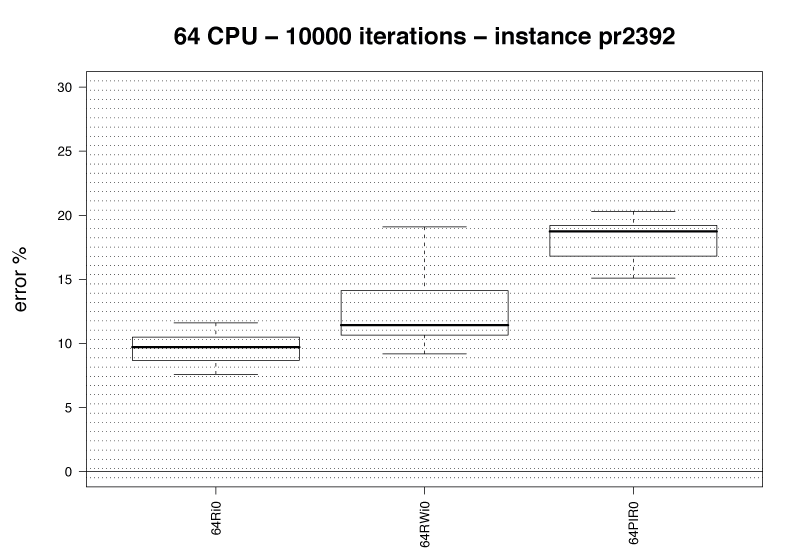 |
||
rl5915 |
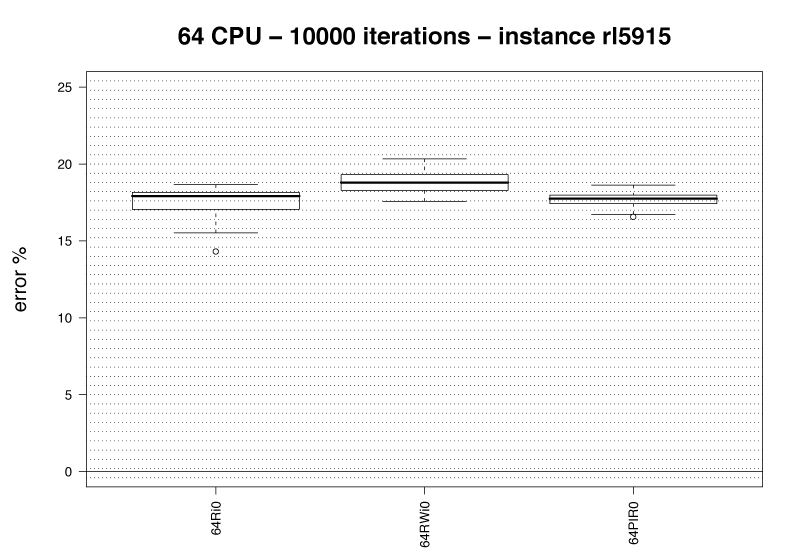 |
||
CPUs |
TSPLIB instance |
Algorithms |
|||
|---|---|---|---|---|---|
xRi2 |
xRWi2 |
xPIR2 |
xSEQ2 |
||
16 |
nrw1379 |
||||
pr2392 |
|||||
rl5915 |
|||||
32 |
nrw1379 |
N.A. |
|||
pr2392 |
N.A. |
||||
rl5915 |
N.A. |
||||
64 |
nrw1379 |
N.A. |
|||
pr2392 |
N.A. |
||||
rl5915 |
N.A. |
||||
| local search | CPUs | TSPLIB instance |
Boxplot of normalized results (click to download eps format) |
|---|---|---|---|
| 2-opt | 16 | nrw1379 |
 |
pr2392 |
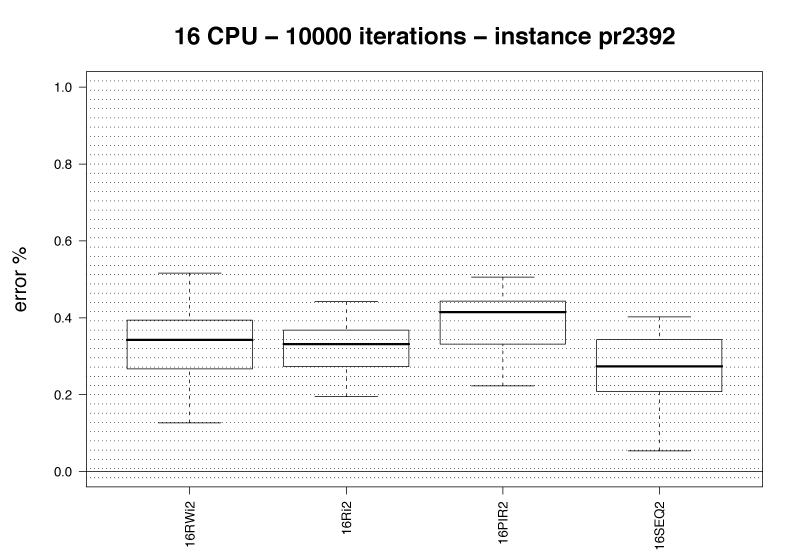 |
||
rl5915 |
 |
||
| 2-opt | 32 | nrw1379 |
 |
pr2392 |
 |
||
rl5915 |
 |
||
| 2-opt | 64 | nrw1379 |
 |
pr2392 |
 |
||
rl5915 |
 |
||
CPUs |
TSPLIB instance |
Algorithms |
|||
|---|---|---|---|---|---|
xRi3 |
xRWi3 |
xPIR3 |
xSEQ3 |
||
16 |
nrw1379 |
||||
pr2392 |
|||||
rl5915 |
|||||
32 |
nrw1379 |
N.A. |
|||
pr2392 |
N.A. |
||||
rl5915 |
N.A. |
||||
64 |
nrw1379 |
N.A. |
|||
pr2392 |
N.A. |
||||
rl5915 |
N.A. |
||||
| local search | CPUs | TSPLIB instance |
Boxplot of normalized results (click to download eps format) |
|---|---|---|---|
| 3-opt | 16 | nrw1379 |
 |
pr2392 |
 |
||
rl5915 |
 |
||
| 3-opt | 32 | nrw1379 |
 |
pr2392 |
 |
||
rl5915 |
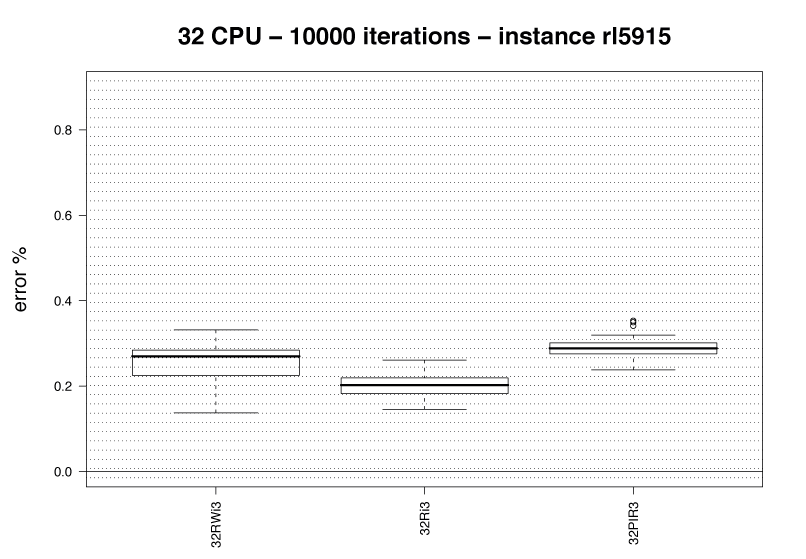 |
||
| 3-opt | 64 | nrw1379 |
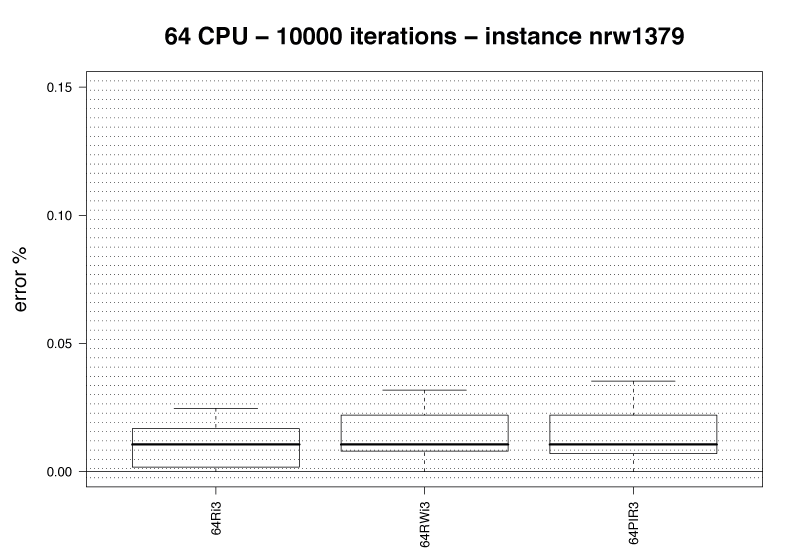 |
pr2392 |
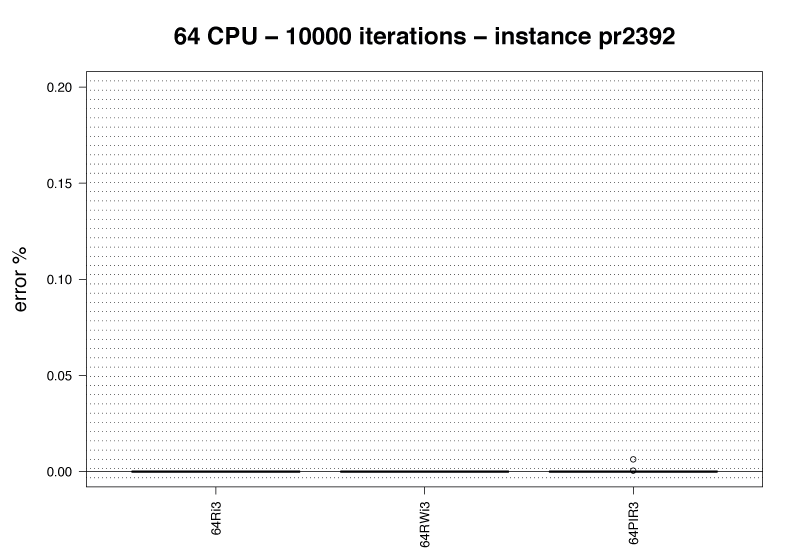 |
||
rl5915 |
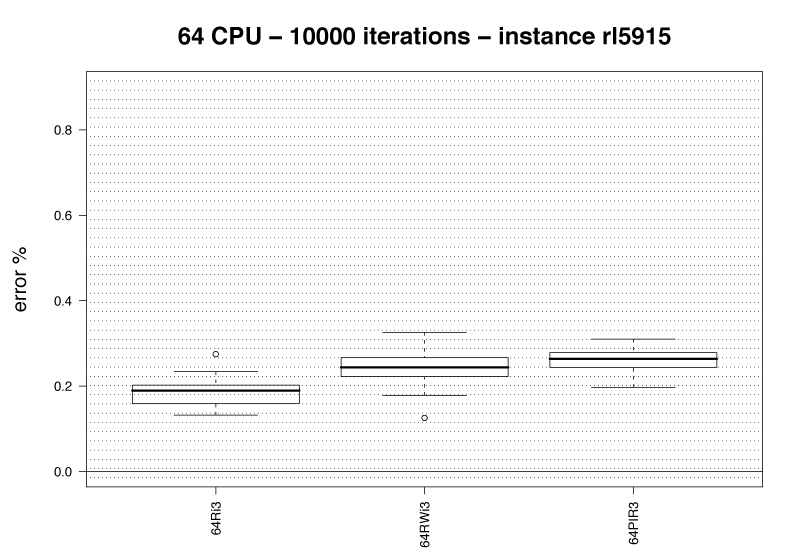 |
||
Results of the two-sided pairwise Wilcoxon rank sum test for all the scalability tests can be found clicking here.
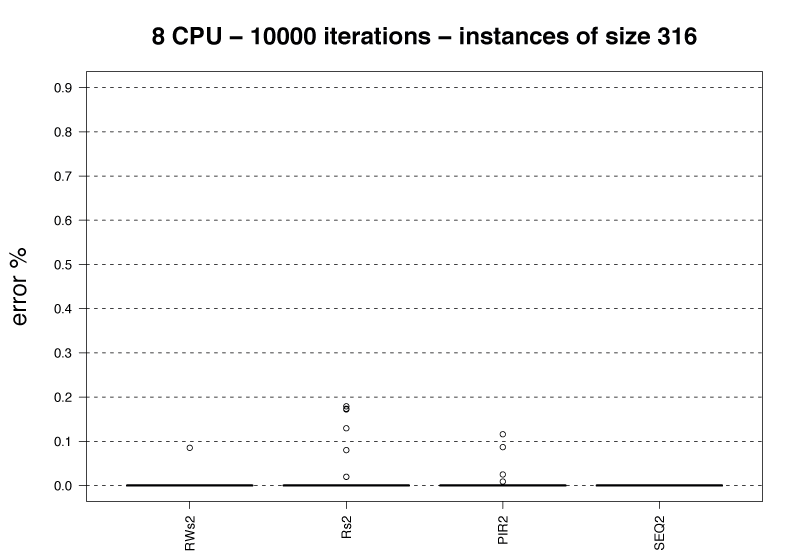
In this last test, we perform some experiments on randomly generated instances to verify our conjecture with unseen instances. We generated several instances of different sizes where cities are distributed uniformly in a square: 30 instances of size 316, 30 instances of size 1000, and 30 instances of size 3162. On each instance, 1 run of 10000 iterations is performed. The results are grouped by instance size and analyzed as if they were multiple runs of a single instance. To assess the statistical significance of the differences in solution costs obtained by the algorithms under analysis, we rely on a two-sided pairwise Wilcoxon rank sum test with p-values adjusted by Holm's method. (To find the optimal value, instances has been solved to the optimum using CONCORDE, and for the few ones for which the optimal solution was not found after 24 hours we took the best solution found by a publicly availabe implementation of the Iterated Lin-Kernigham Helsgaun algorithm)
To contain the computational budget, we limited our test to the treatments 8RWf2 and 8Rf2 versus 8PIR2 and 8SEQ2.
The output of all the experiments for each algorithm is available in the following table:
| TSP Instance | Algorithms |
|---|---|
unif316 |
8RWf2, 8Rf2, 8PIR2, 8SEQ2 |
unif1000 |
8RWf2, 8Rf2, 8PIR2, 8SEQ2 |
unif3162 |
8RWf2, 8Rf2, 8PIR2, 8SEQ2 |
| TSPB Instance | Boxplot of normalized results (click to download eps format) |
|---|---|
unif316 |
 |
unif1000 |
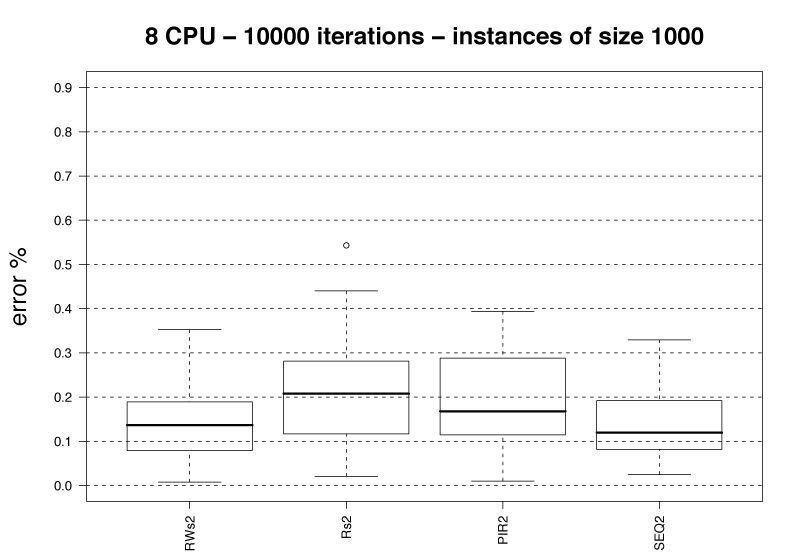 |
unif3162 |
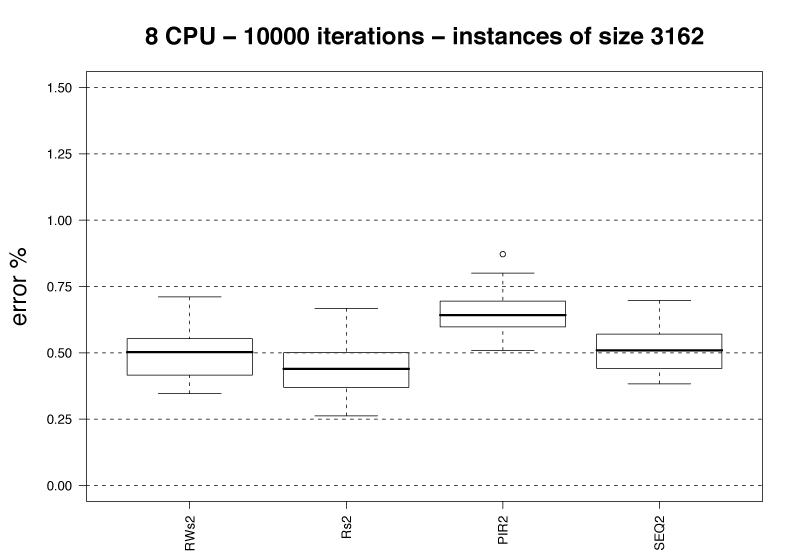 |
Two-sided pairwise Wilcoxon rank sum test with p-values adjusted by Holm's method
[1] "Instance unif3162 - 2-opt local search"
RWs2 Rs2 SEQ2
0 0 0
[1] "Instance unif1000 - 2-opt local search"
RWs2 Rs2 SEQ2
0.065 0.584 0.032
[1] "Instance unif316 - 2-opt local search"
RWs2 Rs2 SEQ2
0.227 0.227 0.227