Supporting material for the paper:
Parallel Ant Colony Optimization Algorithms
for the Traveling Salesman Problem
by Max Manfrin, Mauro Birattari, Thomas Stützle, and Marco Dorigo
April 2006
Abstract:
There are two reasons for parallelizing a metaheuristic if interested in performance: (i) given a fixed time to search, the aim is to increase the quality of the solutions found in that time; (ii) given a fixed solution quality, the aim is to reduce the time needed to find a solution not worse than that quality. In this article, we study the impact of communication when we parallelize a high-performing ant colony optimization (ACO) algorithm for the traveling salesman problem using message passing libraries. In particular, we examine synchronous and asynchronous communications on different interconnection topologies. We find that the simplest way of parallelizing the ACO algorithms, based on parallel independent runs, is surprisingly effective; we give some reasons as to why this is the case.
Keywords: ant colony optimization, parallel programming, traveling salesman problem, message passing
Algorithms:
We modify version 1.0 of ACOTSP, adding the quadrant nearest neighbors heuristic with 20 neighbors and the MPI code to allow communication among different colonies. Except for Parallel Independent Runs, in which no communication takes place, the first letter in the name of each algorithm identifies how the communication is implemented: S means communication is synchronous, and A means communication is asynchronous. The following interconnection topologies are tested:
- Completely-connected (SCC, ACC)
- Replace-worst (SRW, ARW)
- Hypercube (SH, AH)
- Ring (SR, AR)
- Parallel independent runs (PIR)
To have a reference algorithm for comparison, we also tested the equivalent sequential Max-Min Ant System algorithm running: (i) for k-times the time of the parallel algorithms (SEQ), where k=8 is the number of multiple colonies used; (ii) for the same time as the parallel algorithms (SEQ2).
Raw experimental data:
We tested the algorithms on 10 instances available from TSPLIB. The output of all the experiments for each algorithm is available in the following table:
Results:
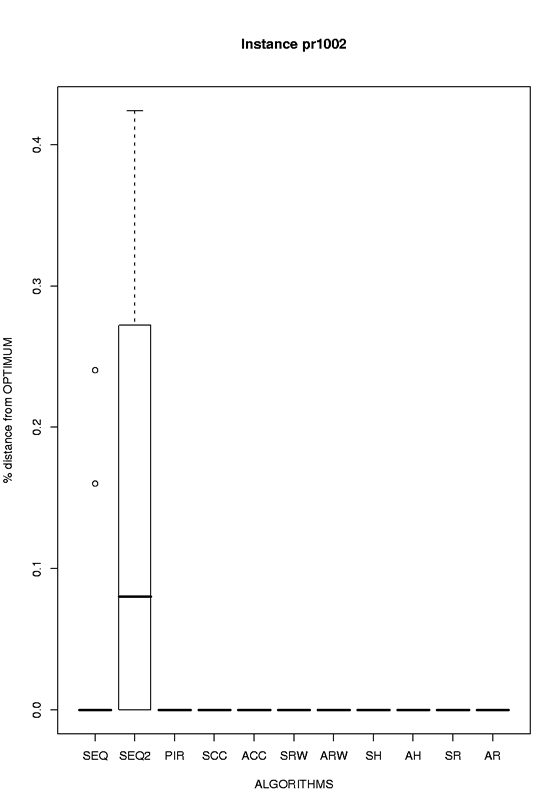
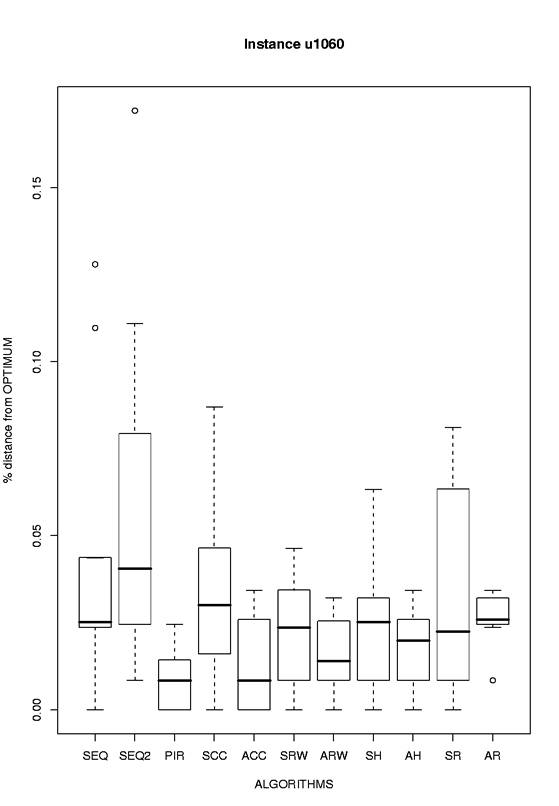
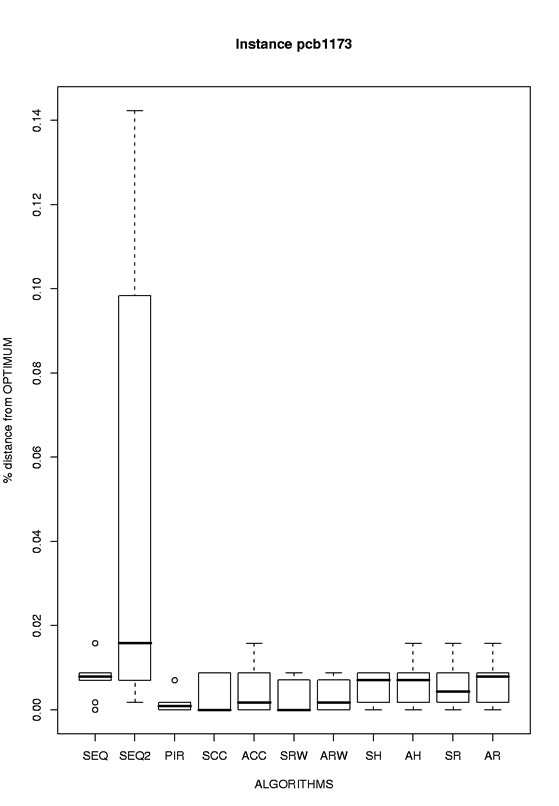
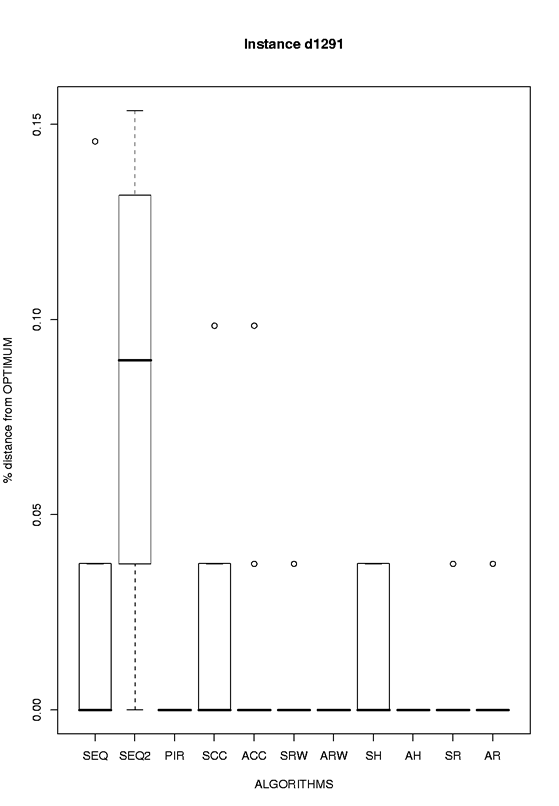
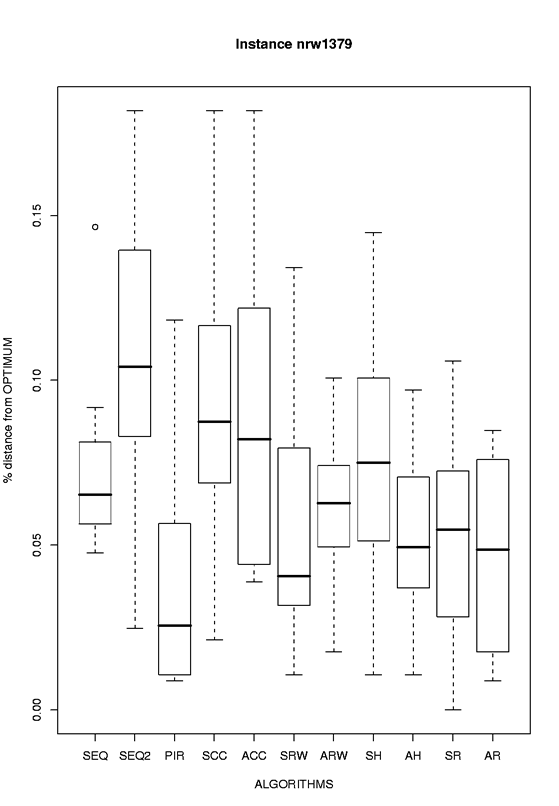
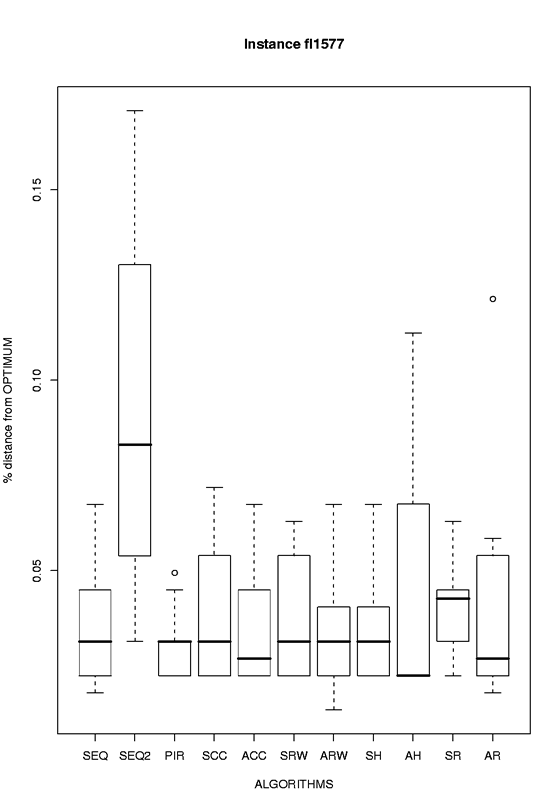
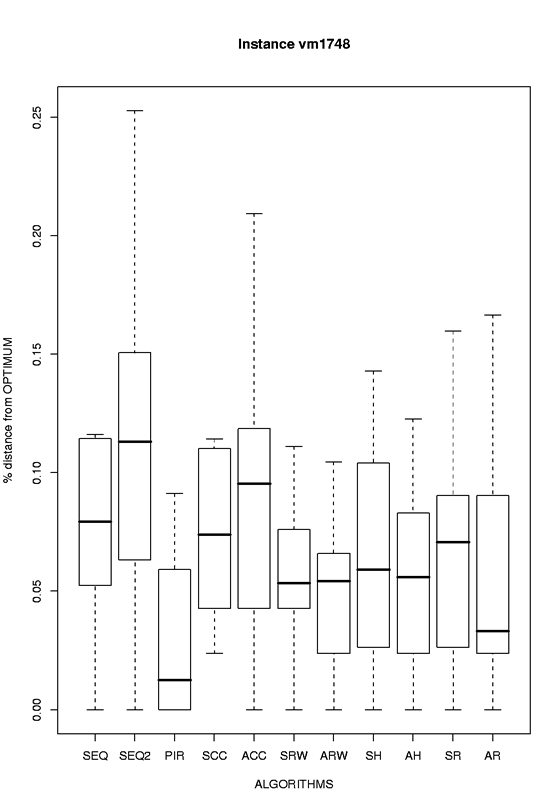
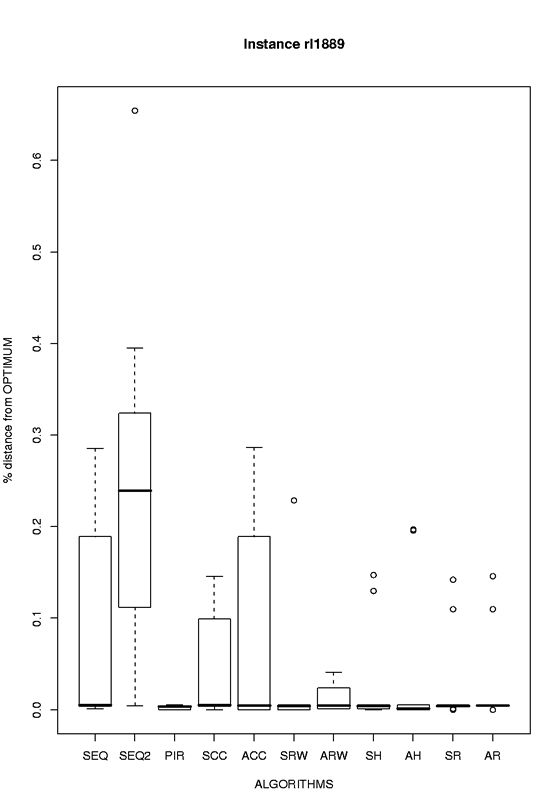
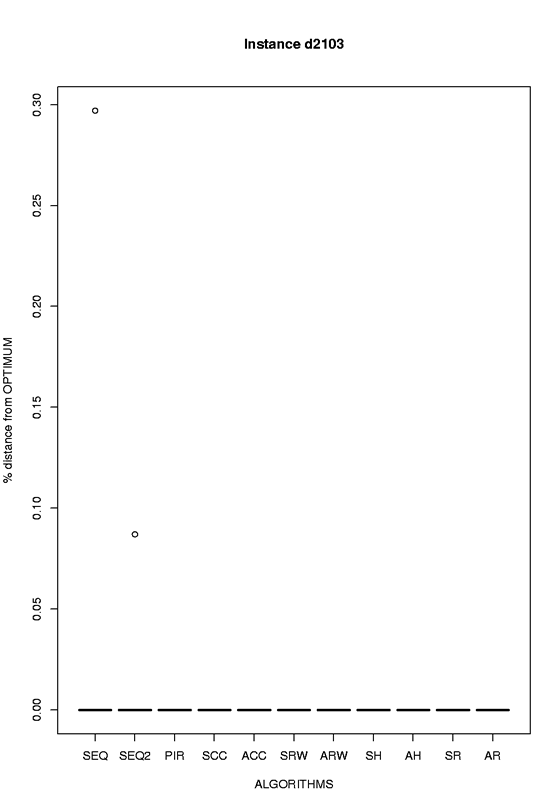
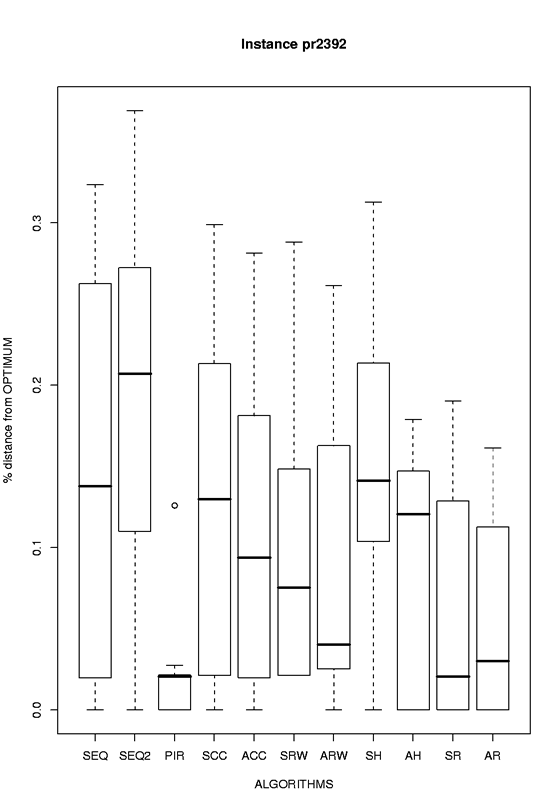
Results for each of the 10 instances grouped by algorithm
| Instance |
Boxplot of normalized results |
Thumbnail
(click to enlarge) |
pr1002 |
eps format, png format |
 |
u1060 |
eps format, png format |
 |
pcb1173 |
eps format, png format |
 |
d1291 |
eps format, png format |
 |
| nrw1379 |
eps format, png format |
 |
| fl1577 |
eps format, png format |
 |
| vm1748 |
eps format, png format |
 |
| rl1889 |
eps format, png format |
 |
| d2103 |
eps format, png format |
 |
| pr2392 |
eps format, png format |
 |
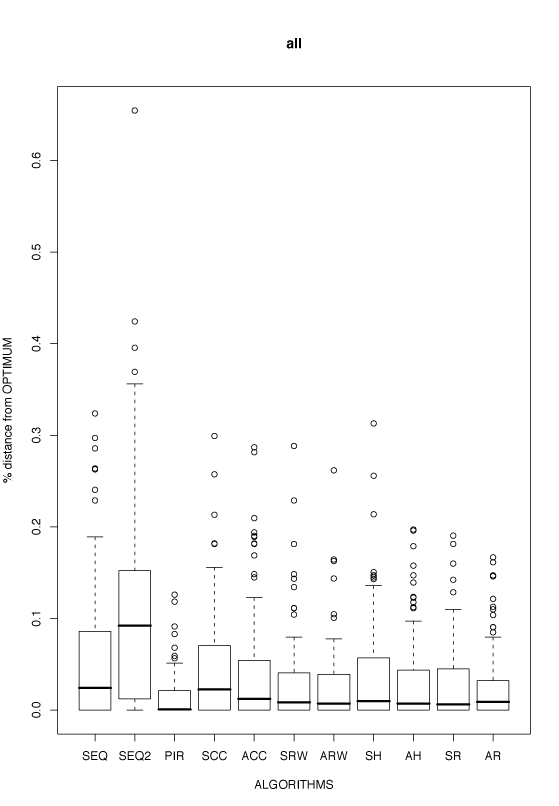
Aggregate results over all 10 instances grouped by algorithm
| Run Time |
Kind of boxplot |
Thumbnail
(click to enlarge) |
full |
Boxplot of normalized results
eps format, png format |
 |
full |
Boxplot of normalized results restricted to values in [0,1]
eps format, png format
|
![Boxplot of aggregated results in [0,1]- full](boxplots/all_fulltime_scaled.png) |
reduced by a factor 1/2 |
Boxplot of normalized results restricted to values in [0,1]
eps format, png format |
![Boxplot of aggregated results in [0,1] - 1/2](boxplots/all_reduced_time_2_scaled.png) |
reduced by a factor 1/4 |
Boxplot of normalized results restricted to values in [0,1]
eps format, png format |
![Boxplot for aggregated results in [0,1] - 1/4](boxplots/all_reduced_time_4_scaled.png) |
reduced by a factor 1/8 |
Boxplot of normalized results restricted to values in [0,1]
eps format, png format |
![Boxplot for aggregated results in [0,1] - 1/8](boxplots/all_reduced_time_8_scaled.png) |
reduced by a factor 1/16 |
Boxplot of normalized results restricted to values in [0,1]
eps format, png format |
![Boxplot for aggregated results in [0,1] - 1/16](boxplots/all_reduced_time_16_scaled.png) |
reduced by a factor 1/32 |
Boxplot of normalized results restricted to values in [0,1]
eps format, png format |
![Boxplot for aggregated results in [0,1] - 1/32](boxplots/all_reduced_time_32_scaled.png) |
reduced by a factor 1/64 |
Boxplot of normalized results restricted to values in [0,1]
eps format, png format |
![Boxplot for aggregated results in [0,1] - 1/64](boxplots/all_reduced_time_64_scaled.png) |
reduced by a factor 1/128 |
Boxplot of normalized results restricted to values in [0,1]
eps format, png format |
![Boxplot for aggregated results in [0,1] - 1/128](boxplots/all_reduced_time_128_scaled.png) |
Even though the boxplot indicates that parallel algorithms achieve, on average, better performance than the sequential ones, the impact of communication on performance seems negative. One reason might be that the run times are rather high, and MMAS easily converges in those times. PIR can count on multiple independent search paths to explore the search space, reducing the effects of the "stagnation" behavior. In fact, the other parallel algorithms accelerate the convergence toward a same solution, due to the frequent exchange of information, as can be verified by the traces of the algorithms.
Second communication scheme:
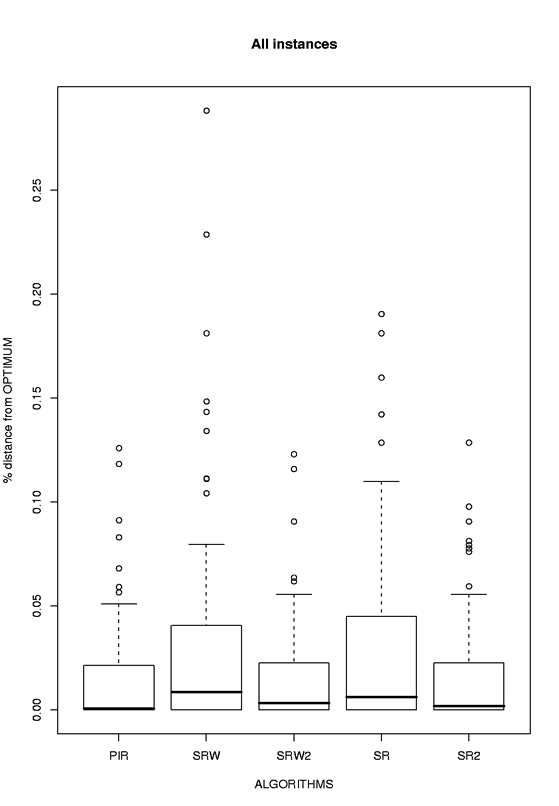
In a second set of experiments we tested a more coarse communication scheme on two of the algorithms (on the same 10 instances available from TSPLIB). The output of all the experiments for each algorithm is available in the following table:
Aggregate results over all 10 instances grouped by algorithm
| Run Time |
Kind of boxplot |
Thumbnail
(click to enlarge) |
full |
Boxplot of normalized results
eps format, png format |
 |


![Boxplot of aggregated results in [0,1]- full](boxplots/all_fulltime_scaled.png)
![Boxplot of aggregated results in [0,1] - 1/2](boxplots/all_reduced_time_2_scaled.png)
![Boxplot for aggregated results in [0,1] - 1/4](boxplots/all_reduced_time_4_scaled.png)
![Boxplot for aggregated results in [0,1] - 1/8](boxplots/all_reduced_time_8_scaled.png)
![Boxplot for aggregated results in [0,1] - 1/16](boxplots/all_reduced_time_16_scaled.png)
![Boxplot for aggregated results in [0,1] - 1/32](boxplots/all_reduced_time_32_scaled.png)
![Boxplot for aggregated results in [0,1] - 1/64](boxplots/all_reduced_time_64_scaled.png)
![Boxplot for aggregated results in [0,1] - 1/128](boxplots/all_reduced_time_128_scaled.png)
