by Christos Ampatzis, Elio Tuci, Vito Trianni, Anders Lyhne Christensen and Marco Dorigo
March 2008
|
Submitted to Artificial Life
Table of Contents |
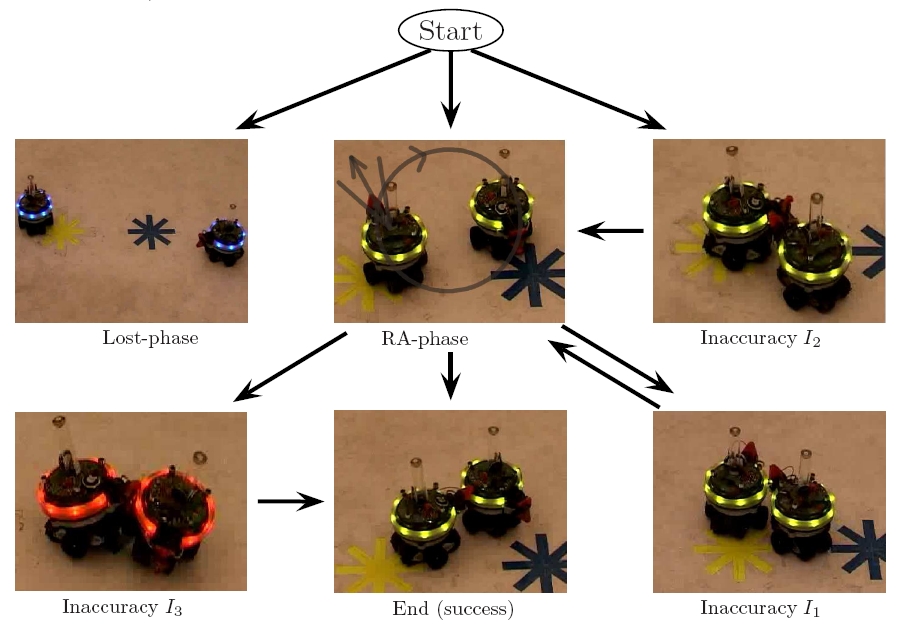
We remind the reader that: I1 refers to a series of maladroit actions by both robots which makes impossible for the s-bot-gripper to successfully grasp the s-bot-grippee's cylindrical turret. I2 refers to those circumstances in which both robots assume the role of s-bot-gripper and collide at the level of their grippers. I3 refers to those circumstances in which, after grasping, the connected structure gets slightly elevated at the connection point. Failures correspond to trials in which the robots do not manage to return to a distance from each other smaller than their visual field.
Below are sample movies from the experiments performed:
We also performed some sample experiments with 3 robots. Here is a movie sample of a
successful trial: .wmv
Here you can access the page containing all the video recordings of the experiments performed and a brief description of their outcome.
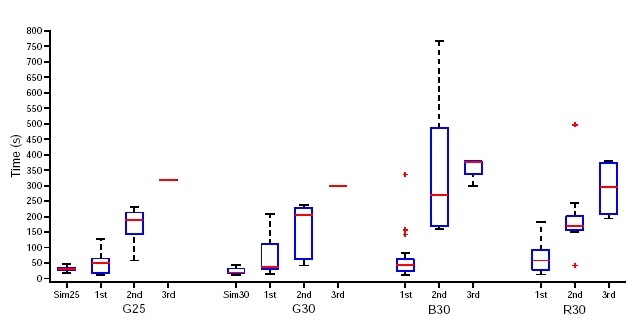
Boxplot showing the length of successful trials at the 1
The boxplot shows the distribution of the length of trials with and without inaccuracies per post-evaluation test of real and simulated s-bots. Data concerning simulated s-bots (i.e., SimG25, SimG30) has been collected by placing the simulated agents in the same initial orientations as the real s-bots in the corresponding tests. That is, in SimG25 the simulated agents are placed as the real s-bots in G25; in SimG30 the simulated agents are placed as the real s-bots in G30, B30 and R30. By comparing the median of the distributions of simulated and real s-bots, we noticed that, for each pair of sets of trials, real s-bots tend to take longer time to accomplish their task than simulated agents. It seems that the real world noise, and other phenomena not modelled in our simulated world (e.g., friction), by affecting the dynamics of the evolved controllers, tends to increase the time required by the s-bots to physically assemble. The reader should bear in mind that, in spite of the difference between the length of trials of real and simulated s-bots, the robots' controllers proved to be robust enough to accomplish the task with high success rates in both environment. By looking at the figure, we also notice that the coloured light emitted by the LED does not seem to have any clear effect on the length of the successful trials with a single gripping attempt. As expected, trials that required more than one gripping attempt lasted longer than those in which the s-bots managed to assemble at the first attempt.