features
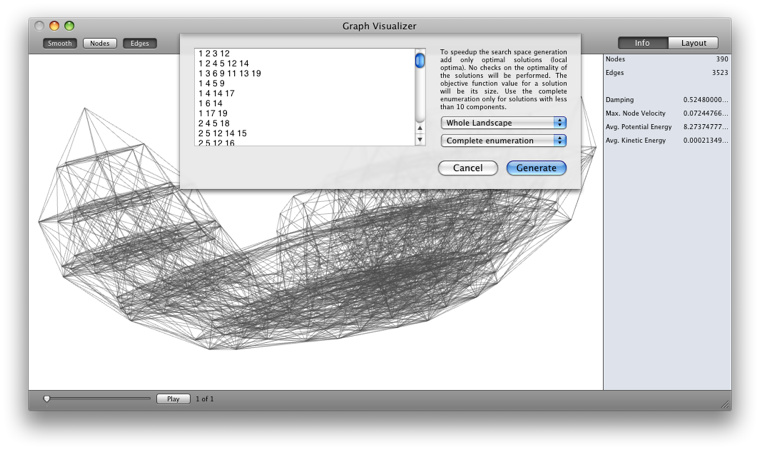
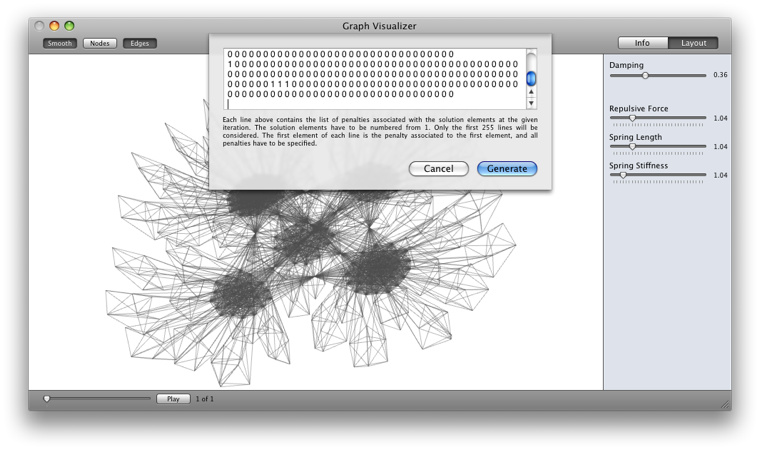
Graph Visualizer is a tool for visualizing graphs and laying them out automatically. It can be used for the most diverse tasks: its xml based input format allows for easily importing data from other applications and visualizing / navigating the results of your experiments. A python library with helper classes to convert your data is available in the download section.
In the program you'll also find a plugin for generating Gilbert graphs, and a plugin (SLV) for the visualisation of search landscapes.
Since Graph Visualizer is a multi-threaded application, you can adjust in real time several parameters of the graph layout and render. The graphs can be navigated with the keyboard or using the gestures on your trackpad, and by clicking on the nodes, you can display information about the node you have selected. The layout is spring-based with an adaptive damping, but for very big instances you can also adjust the damping manually. The graphs displayed can be exported to several raster image formats at different resolutions (there is full screen anti-alias and a super-sampling for exporting at very high resolutions). Moreover, the edge structure can be exported to vectorial image formats.
download
Graph Visualizer is free for academic use, if you use it in your scientific work please cite the paper below.
The package is for Mac Os X 10.5 (Leopard) and requires a video card with hardware acceleration. Although all operations can be performed from the keyboard, the recommended hardware is a laptop with hardware acceleration and support for at least 3 finger gestures (i.e., late 2008 unibody MacBooks and early 2008 MacBooks pros).
The instructions on how to use Graph Visualizer are available from the Help menu (Command-Option-?).
 | Graph Visualizer 0.8.6b download |
The software has been tested on Mac Os X 10.5 (Leopard), some stability issues could arise when used on more recent versions of OS X.
A new version for OS X 10.9 (Mavericks) is in the workings.
In the archive below, there are some handy python scripts, to convert from other formats to the XML-based input files of Graph Visualizer.
 | GVFiles Python library download |
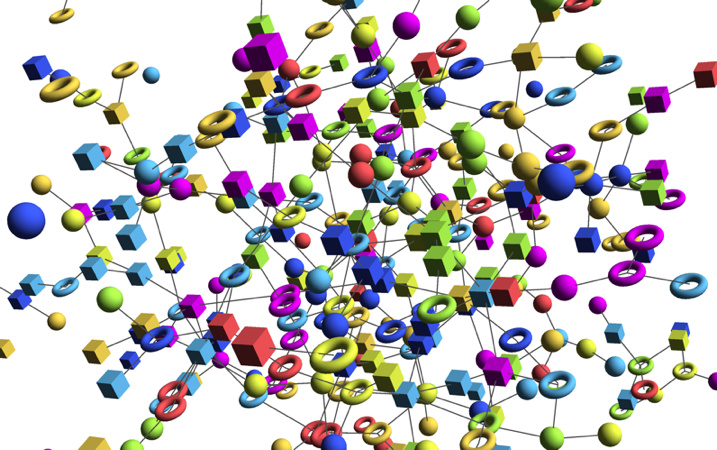
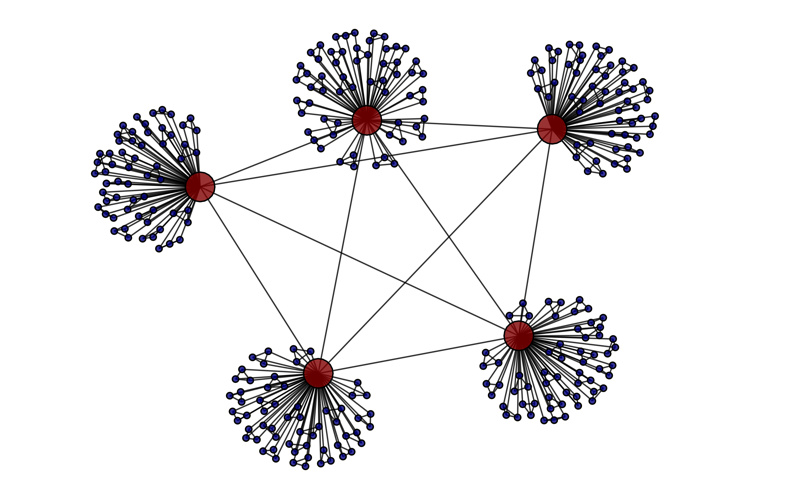
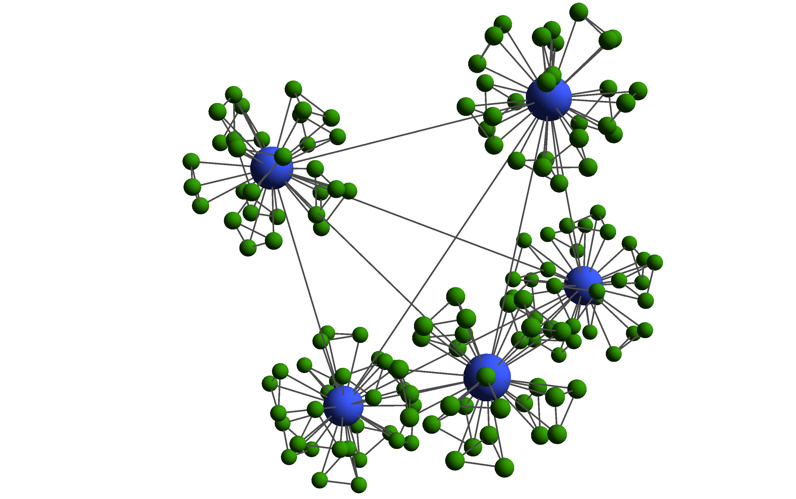
screenshots
Examples of images generated With Graph Visualizer

slv
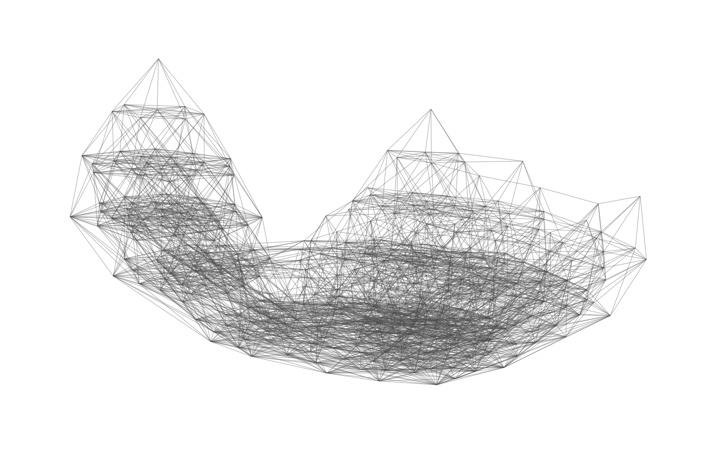
SLV stands for Search Landscape Visaulization. It is a plugin for Graph Visualizer that allows for the representation of Search Landscapes of combinatorial optimization problems. It uses the spring layout with adaptive damping to scale the dimensions of a neighborhood graph to a three dimensional space, allowing for an intuitive representation of the landscape. The plugin generates the search space in an exact or approximated way starting from maximal solutions (local optima). The combinatorial optimization problem must be discrete, and all sub solution have to be valid solutions:
research paper
The plugin as well as Graph Visualizer are described in:
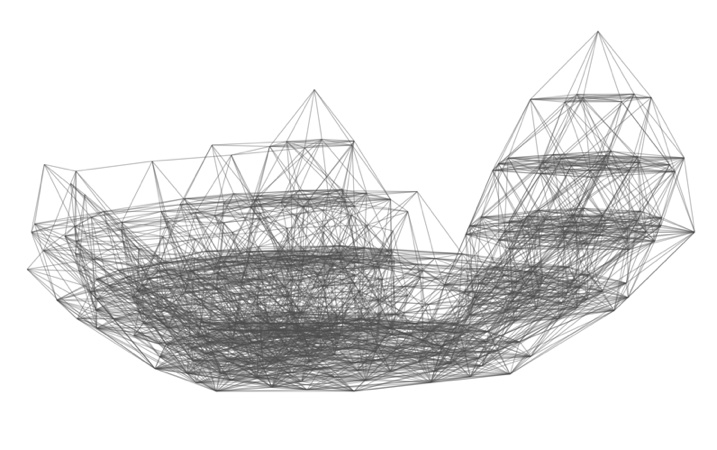
complete enumeration
Once the landscape is laid out, the instances can be covered with a NURBS-cloth with different levels of resolution. Of course since this is a complete enumeration, covering the surface with a cloth having too much detail could lead to artificial minima. The NURBS covering is more suited for the approximate representations.

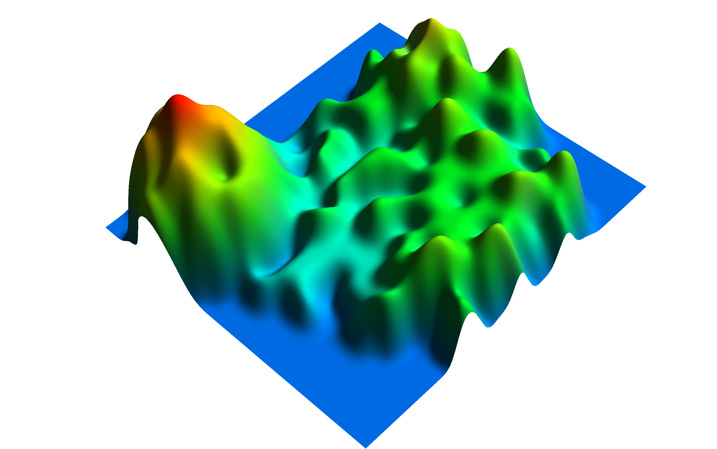
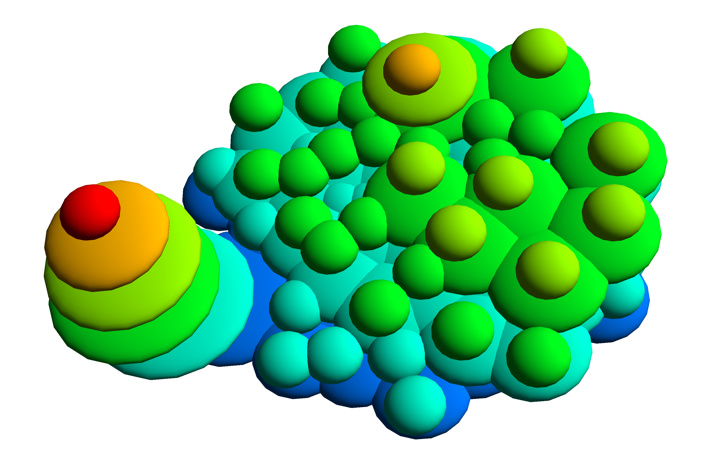
approximated landscape
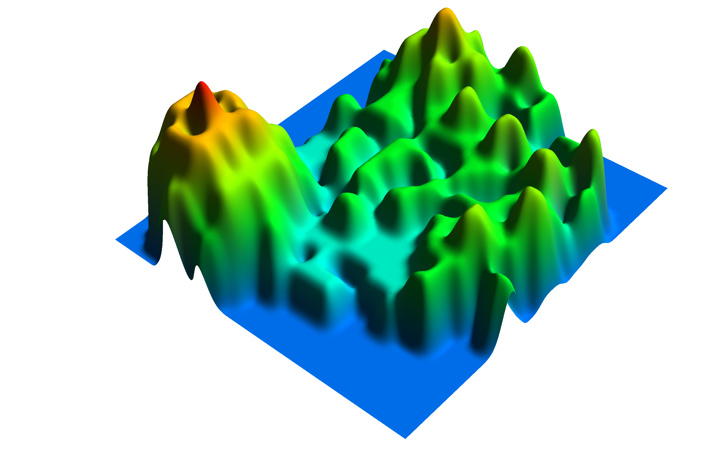
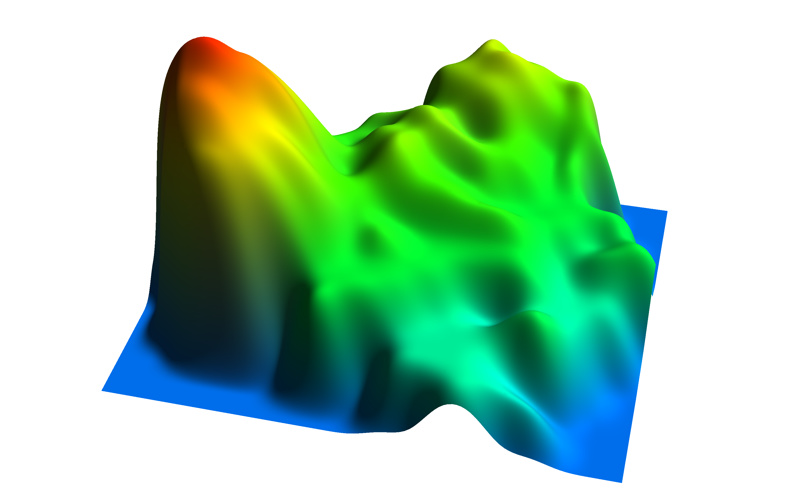
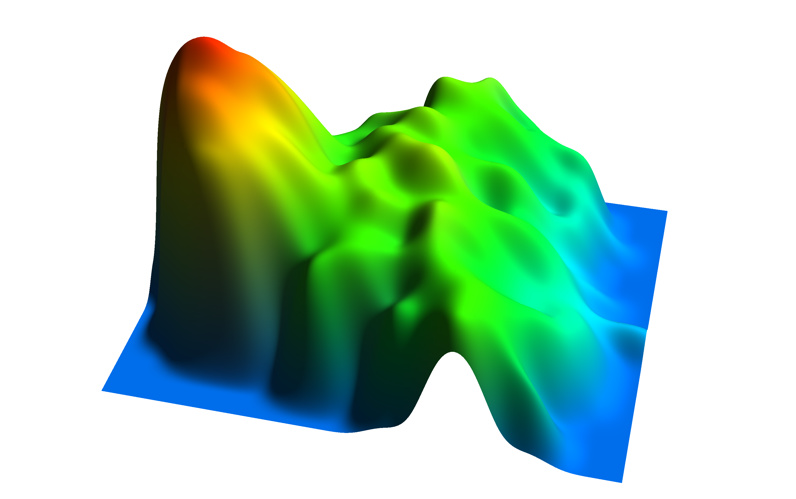
An approximated landscape generation does not enumerate all the solutions, for the same graph an approximated solution and a detailed NURBS-cloth on top of it are displayed below:
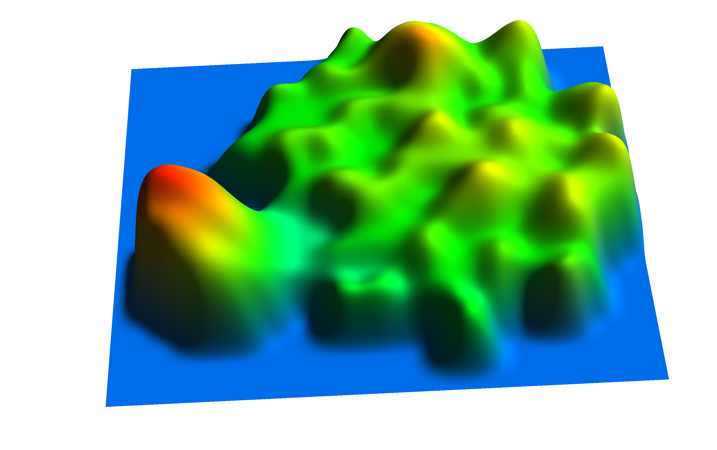
in order to make the picture clearer, one can increase the "sea level", i.e. put a limit on the quality of the solutions to enumerate, and enhance some features of the landscape, like the separation between the peak and the plateau in the picture below:
search space sampling
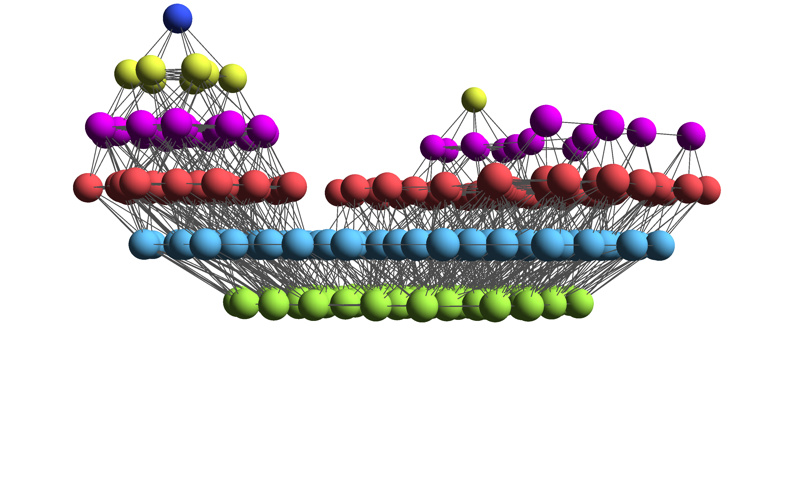
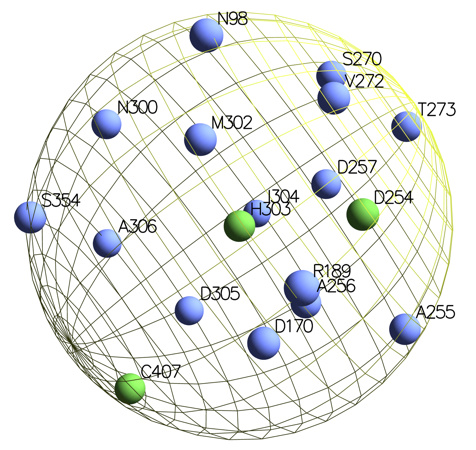
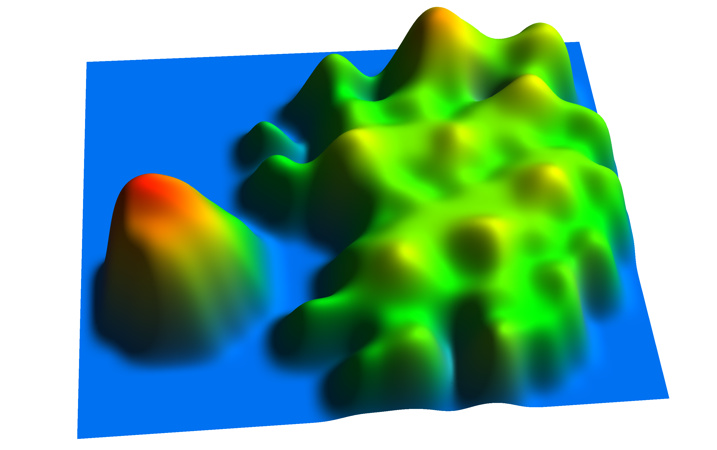
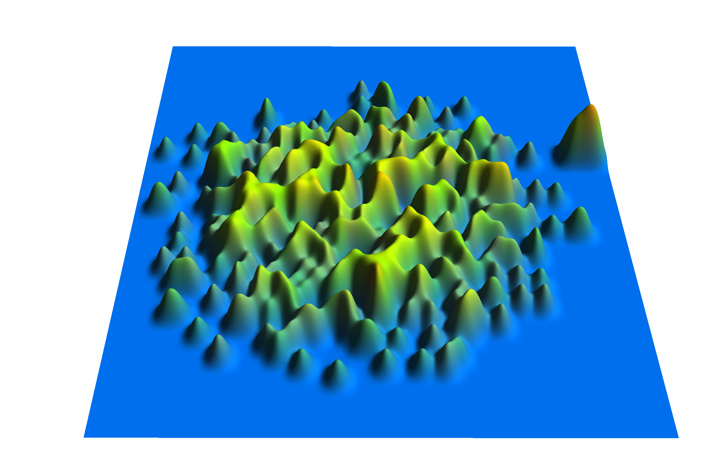
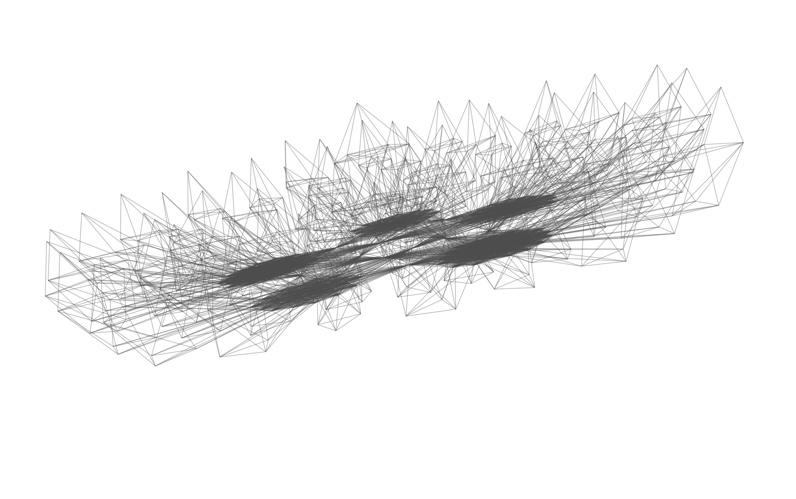
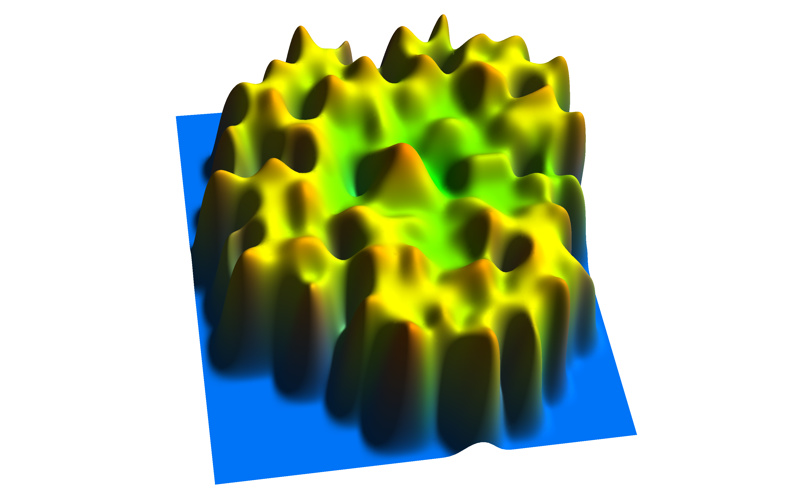
In the following example, starting from 95855 maximal cliques of a Gilbert random graph, the only maximum solution (size 10) is on the left isolated from the 400 solutions which were at the shortest hamming distance from the optimum. The hardness of the instance (empirically assessed) is shown from the huge amount of quasi-optimum cliques which is evident already in this utterly small selection of maximal cliques which are a sub-sample of the whole search space:
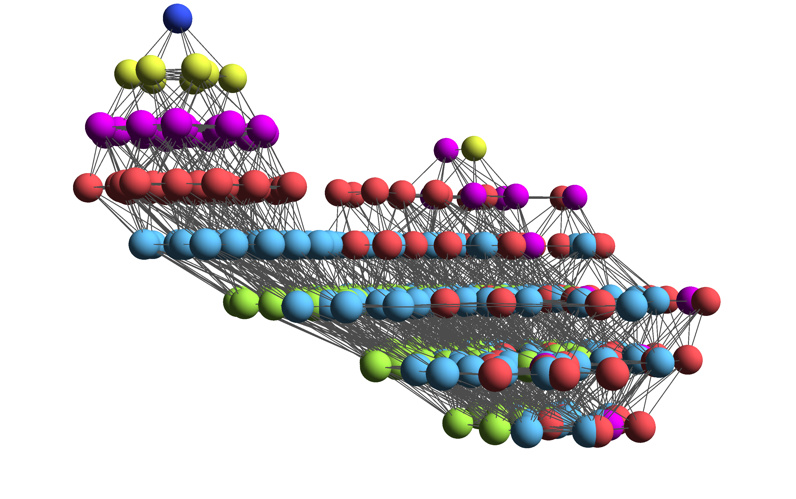
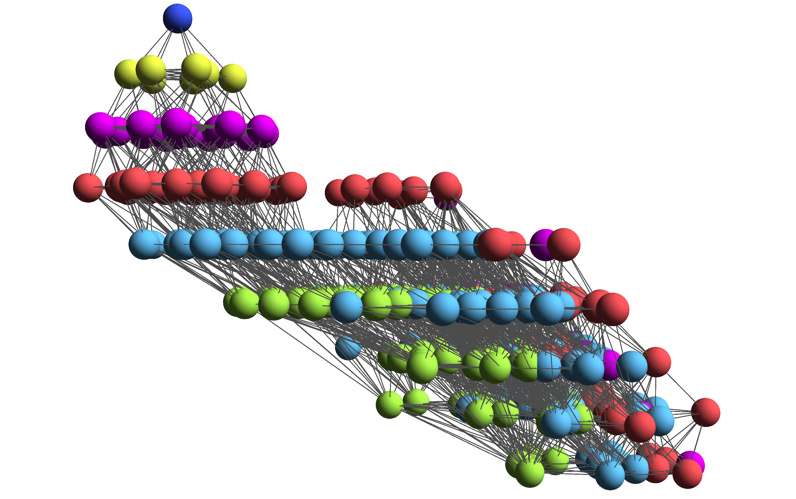
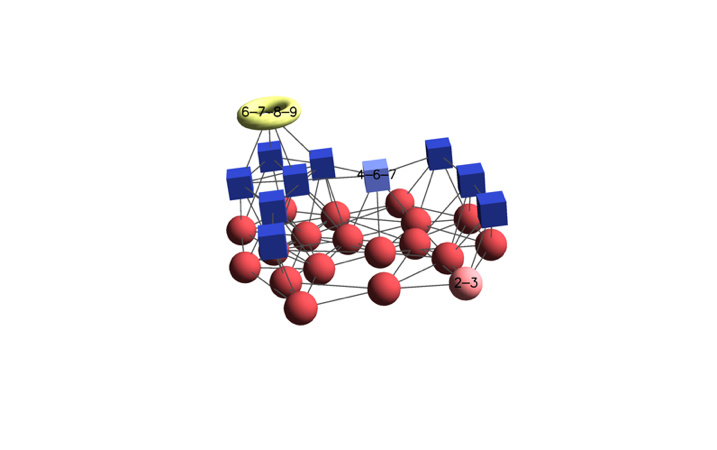
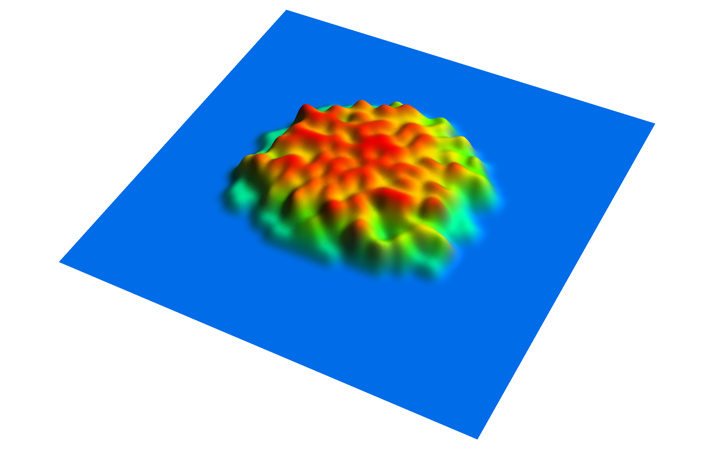
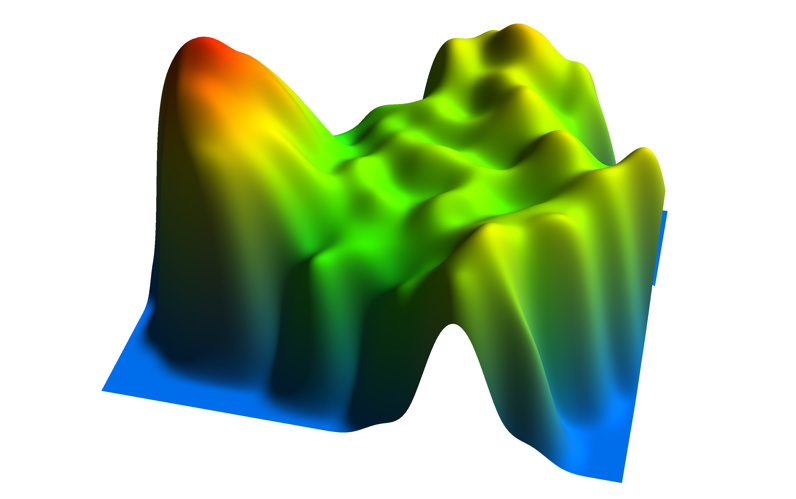
on the contrary, this preferential-attachment random graph of the same size gives rise to much more structured landscape. From the 20097 maximal cliques which have been enumerated a subset of the nearest 100 ones is generated and the depth limited to 4 levels (from the maximum 67 to 63). There are several cliques of maximum quality and they share most of the nodes:
objective and evaluation functions
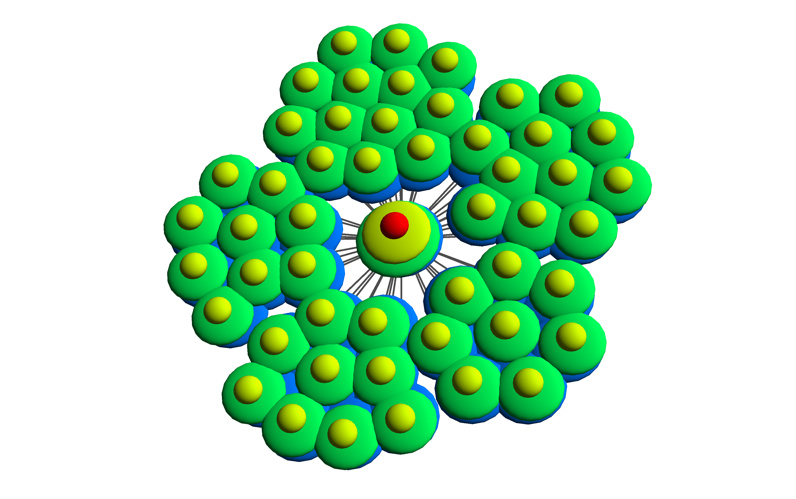
With the SLV plugin one can plot the search landscape starting from the objective function, or an evaluation function. In the example below the landscape is generated for different evaluation functions. The following example is built in order to trick penalty based local search algorithms:
it has a maximum clique of size 5 and 50 maximum cliques of size 4 sharing a node with the maximum one. Every time a penalty based algorithm for the maximum clique penalizes the nodes belonging to a local optimum it also penalizes a node from the global optimum. The search landscape is the following one:

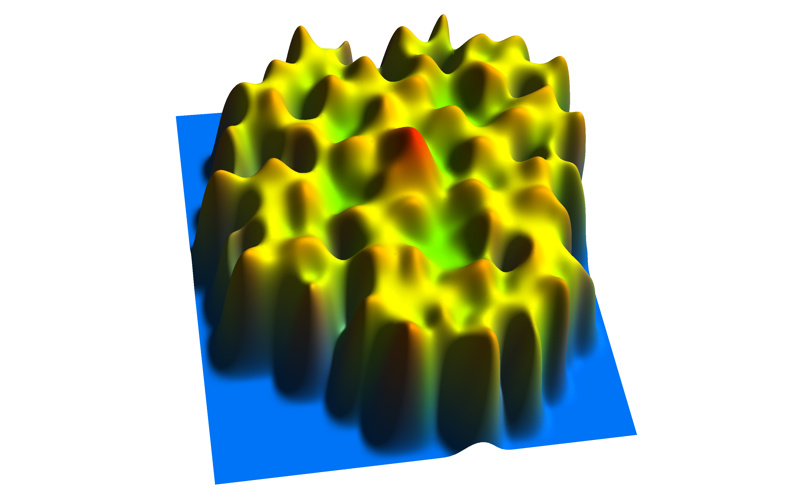
adding the penalties values at the various iteration one can have a dynamic representation, from which the following example snapshots were taken:

please note that the example above is a maximization problem. The penalization of a local optimum can be represented as the decrease of the evaluation function value corresponding to that optimum. As it's clear from the images every time a local optimum is penalized it affects the global optimum.
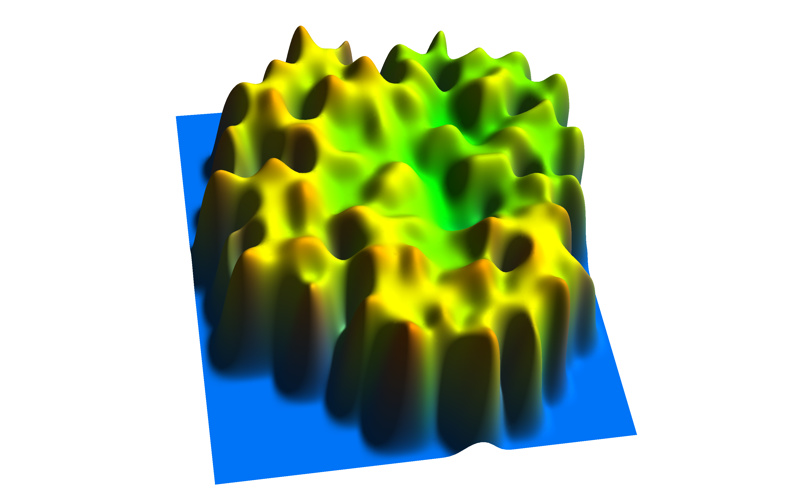
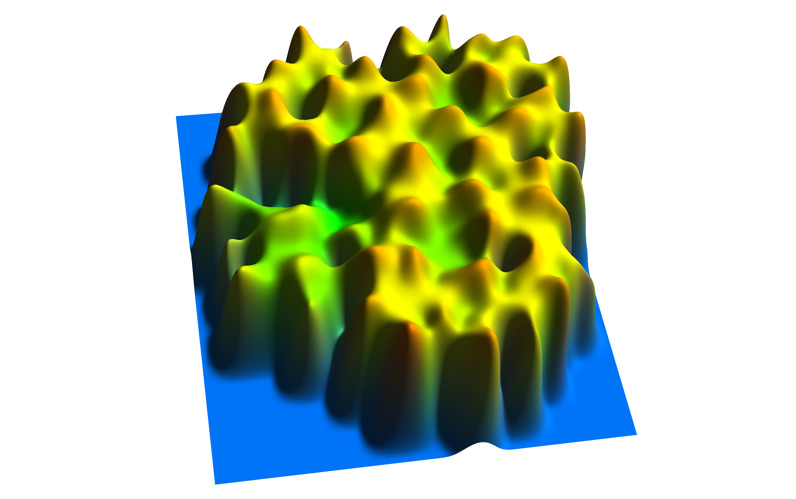
In this other case the penalization has the desired effect:
which is even more evident in the plain 3D complete representation, where the peaks in the plateau are progressively reduced, and the probability to reach the optimum from a smaller set of starting nodes increases: