Repository of R scripts used by IRIDIA members
From IridiaWiki
Revision as of 21:26, 11 August 2006 by Mmanfrin (talk | contribs) (→Boxplot of solution values by algorithm)
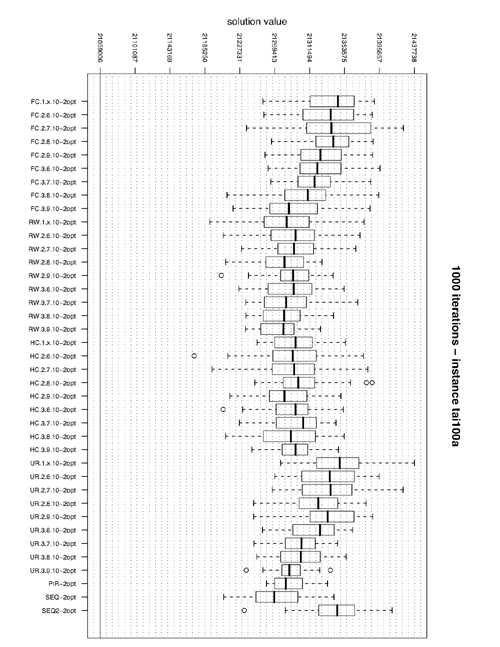
Boxplot of solution values by algorithm
I organize the data in the following way:
in the file optimal_values_xxx.txt i put the best-known solution values for the problem instances I'm testing
cat optimal_values_100.txt

instance optimum group
sko100a 152002 1
sko100e 149150 1
tai100a 21059006 1
tai100b 1185996137 1
in the files algo.factori.instance_size.cut_time.txt i record the history of the search of the algo for the instance
euclides:~/Desktop/Parallel-QAP/out/analysis/2-opt mmanfrin$ head sequential_2-opt_100_8000.txt
idalgo  topo    schema  ls      type    cpu_id  instance        try     best    time    iteration
SEQ-2opt        SEQ     SEQ     2       Seq     0       sko100a         1       155468  0.31    1
SEQ-2opt        SEQ     SEQ     2       Seq     0       sko100a         1       155390  0.31    1
SEQ-2opt        SEQ     SEQ     2       Seq     0       sko100a         1       155000  0.31    1
SEQ-2opt        SEQ     SEQ     2       Seq     0       sko100a         1       154934  0.64    2
SEQ-2opt        SEQ     SEQ     2       Seq     0       sko100a         1       154608  0.97    3
SEQ-2opt        SEQ     SEQ     2       Seq     0       sko100a         1       153958  1.27    4
SEQ-2opt        SEQ     SEQ     2       Seq     0       sko100a         1       153750  1.93    6
SEQ-2opt        SEQ     SEQ     2       Seq     0       sko100a         1       153720  1.93    6
SEQ-2opt        SEQ     SEQ     2       Seq     0       sko100a         1       153634  2.57    8
In order to produce boxplots like the one above you can look at the R source used to produce it.
optimal_values<-read.table("optimal_values_100.txt",header=TRUE)
resPIR2OPT<-read.table("parallel_independent_2-opt_100_100.txt",header=TRUE)
resSEQ2OPT<-read.table("sequential_2-opt_100_800.txt",header=TRUE)
resSEQ22OPT<-read.table("sequential2_2-opt_100_100.txt",header=TRUE)
resFC1x102OPT<-read.table("fc.1.x.10_2-opt_100_100.txt",header=TRUE)
resFC26102OPT<-read.table("fc.2.6.10_2-opt_100_100.txt",header=TRUE)
resFC27102OPT<-read.table("fc.2.7.10_2-opt_100_100.txt",header=TRUE)
resFC28102OPT<-read.table("fc.2.8.10_2-opt_100_100.txt",header=TRUE)
resFC29102OPT<-read.table("fc.2.9.10_2-opt_100_100.txt",header=TRUE)
resFC36102OPT<-read.table("fc.3.6.10_2-opt_100_100.txt",header=TRUE)
resFC37102OPT<-read.table("fc.3.7.10_2-opt_100_100.txt",header=TRUE)
resFC38102OPT<-read.table("fc.3.8.10_2-opt_100_100.txt",header=TRUE)
resFC39102OPT<-read.table("fc.3.9.10_2-opt_100_100.txt",header=TRUE)
resHC1x102OPT<-read.table("hc.1.x.10_2-opt_100_100.txt",header=TRUE)
resHC26102OPT<-read.table("hc.2.6.10_2-opt_100_100.txt",header=TRUE)
resHC27102OPT<-read.table("hc.2.7.10_2-opt_100_100.txt",header=TRUE)
resHC28102OPT<-read.table("hc.2.8.10_2-opt_100_100.txt",header=TRUE)
resHC29102OPT<-read.table("hc.2.9.10_2-opt_100_100.txt",header=TRUE)
resHC36102OPT<-read.table("hc.3.6.10_2-opt_100_100.txt",header=TRUE)
resHC37102OPT<-read.table("hc.3.7.10_2-opt_100_100.txt",header=TRUE)
resHC38102OPT<-read.table("hc.3.8.10_2-opt_100_100.txt",header=TRUE)
resHC39102OPT<-read.table("hc.3.9.10_2-opt_100_100.txt",header=TRUE)
resRW1x102OPT<-read.table("rw.1.x.10_2-opt_100_100.txt",header=TRUE)
resRW26102OPT<-read.table("rw.2.6.10_2-opt_100_100.txt",header=TRUE)
resRW27102OPT<-read.table("rw.2.7.10_2-opt_100_100.txt",header=TRUE)
resRW28102OPT<-read.table("rw.2.8.10_2-opt_100_100.txt",header=TRUE)
resRW29102OPT<-read.table("rw.2.9.10_2-opt_100_100.txt",header=TRUE)
resRW36102OPT<-read.table("rw.3.6.10_2-opt_100_100.txt",header=TRUE)
resRW37102OPT<-read.table("rw.3.7.10_2-opt_100_100.txt",header=TRUE)
resRW38102OPT<-read.table("rw.3.8.10_2-opt_100_100.txt",header=TRUE)
resRW39102OPT<-read.table("rw.3.9.10_2-opt_100_100.txt",header=TRUE)
resUR1x102OPT<-read.table("ur.1.x.10_2-opt_100_100.txt",header=TRUE)
resUR26102OPT<-read.table("ur.2.6.10_2-opt_100_100.txt",header=TRUE)
resUR27102OPT<-read.table("ur.2.7.10_2-opt_100_100.txt",header=TRUE)
resUR28102OPT<-read.table("ur.2.8.10_2-opt_100_100.txt",header=TRUE)
resUR29102OPT<-read.table("ur.2.9.10_2-opt_100_100.txt",header=TRUE)
resUR36102OPT<-read.table("ur.3.6.10_2-opt_100_100.txt",header=TRUE)
resUR37102OPT<-read.table("ur.3.7.10_2-opt_100_100.txt",header=TRUE)
resUR38102OPT<-read.table("ur.3.8.10_2-opt_100_100.txt",header=TRUE)
resUR39102OPT<-read.table("ur.3.9.10_2-opt_100_100.txt",header=TRUE)

res<-rbind(resFC1x102OPT,resFC26102OPT,resFC27102OPT,resFC28102OPT,resFC29102OPT,resFC36102OPT,resFC37102OPT,resFC38102OPT,resFC39102OPT,resRW1x102OPT,resRW26102OPT,resRW27102OPT,resRW28102OPT,resRW29102OPT,resRW36102OPT,resRW37102OPT,resRW38102OPT,resRW39102OPT,resHC1x102OPT,resHC26102OPT,resHC27102OPT,resHC28102OPT,resHC29102OPT,resHC36102OPT,resHC37102OPT,resHC38102OPT,resHC39102OPT,resUR1x102OPT,resUR26102OPT,resUR27102OPT,resUR28102OPT,resUR29102OPT,resUR36102OPT,resUR37102OPT,resUR38102OPT,resUR39102OPT,resPIR2OPT,resSEQ2OPT,resSEQ22OPT)

linstance<-levels(res$instance)

res.split<-split(1:nrow(res), list(res$instance, res$try, res$idalgo), drop=TRUE)

min.list <- lapply(res.split, function(x){
        x[match(min(res$best[x]), res$best[x])]
        })

min.vector <- unlist(min.list)

bestalgo<-res[min.vector,]

bestalgo.split <- split(1:nrow(bestalgo), bestalgo$instance, drop=TRUE)

for (i in (1:length(bestalgo.split)))
{
        bestalgo.vector <- unlist(bestalgo.split[i])
        bestalgo.temp <- bestalgo[bestalgo.vector,]
        l<-split(bestalgo.temp$best,bestalgo.temp$idalgo)

        epsfile=paste(linstance[i],"_100_nolim.eps",sep="")
        postscript(file=epsfile,onefile=TRUE,horizontal=TRUE)
        par(mar=c(5,5,5,3),cex.axis=0.7,las=2,mgp=c(4, 1, 0))
        title_plot=paste("100 iterations - instance ",linstance[i],sep="")
        boxplot(l,xlab="",ylab="solution value",names=c(levels(bestalgo$idalgo)),main=title_plot,yaxt="n",ylim=c(optimal_values[optimal_values$instance==linstance[i],]$optimum,max(bestalgo.temp$best)))
        axis(2, seq(from=optimal_values[optimal_values$instance==linstance[i],]$optimum,to=max(bestalgo.temp$best),length.out=10))
        abline(h=optimal_values[optimal_values$instance==linstance[i],]$optimum)
# draw an orizontal line at the y-level of the best-know solution value
        grid(nx=0, ny=55,col="gray5")
        dev.off()
}
