Supporting material for the paper:
The Evolution of Acoustic Communication Between Two Robots
by Elio Tuci and Christos Ampatzis.
April 2007
Fitness Issues:
| This file (pdf) gives
details of the fitness function by explaining how the average fitness
score (F) is computed. |
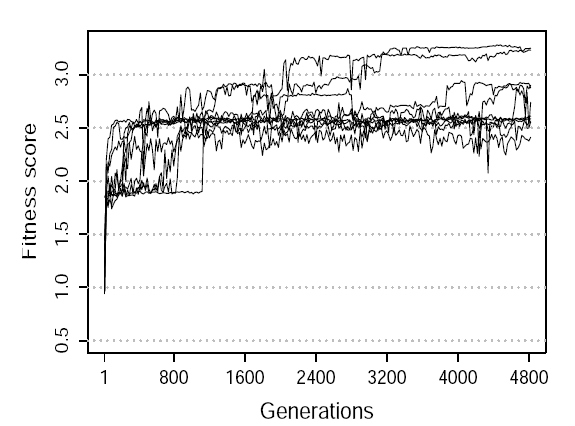 |
The figure above is the Fitness graph of the best groups at each
generation of ten evolutionary runs. Notice that only two evolutionary
runs managed to produce groups whose average fitness F is close to the
maximum score. However, fitness scores lower than 3.4 might be
associated to equally successful alternative strategies. In
particular, successful strategies may have the fitness component Fc <
1 in case Mc doesn't correctly set Sc for the entire length of the
time interval from tc to T as demanded by the fitness function (see
equation 5 and 6 in Sec. 4 of the paper). For a group to be
successful, what matters is that (i) Mc is capable of discriminating
environment in which the door revolves clockwise from those in which
the door revolves anticlockwise; (ii) this discrimination is made
available to Mc through the value of Sc; (iii) differences in time of
Sc's reading induce different behavioral responses. How these
processes are implemented may vary with respect to the nature of the
mechanisms found by evolution. Not all the implementations which allow
a group to be successful get the highest fitness score.
Correctness of Signal Sc Table
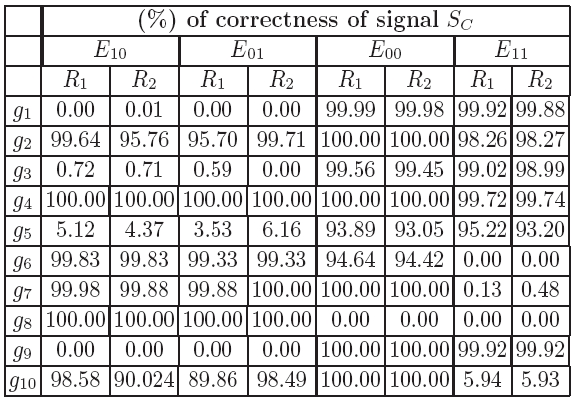 |
Post-evaluation analysis of the 10 best groups. This table shows the
percentage of the correctness of the binary categorisation signal
Sc. We can see that it is very high (>95%) for all environments and
both robots only for the two successful evolutionary runs g2 and g4.
Failure due to trial-and-error strategy Table
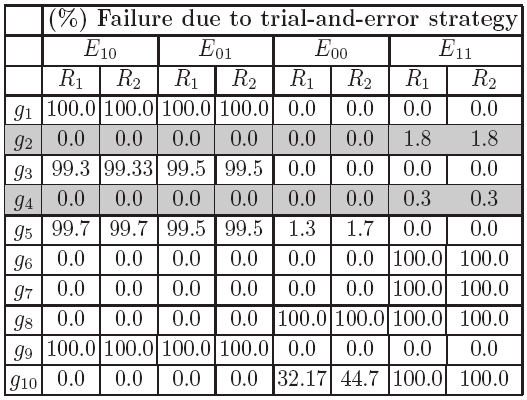 |
Post-evaluation analysis of the 10 best groups. This table shows the
percentage of unsuccessful trials per robot in each type of
environment due to trial-and-error strategy. This corresponds to a
robot exerting forces in both arms of the revolving door (i.e., west
and east of L3) instead of touching the bar on the correct side. In
grey the succesful groups.
Failure due to collisions Table
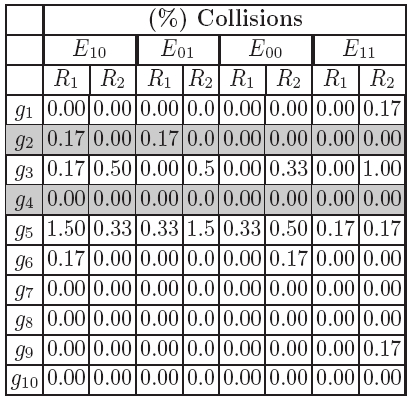 |
Post-evaluation analysis of the 10 best groups. This table shows the
percentage of unsuccessful trials per robot in each type of
environment due to collisions. In grey the succesful groups. As we can
see from the table, failure due to collisions are very rare.
Movies:
 |
Below are sample movies from the experiments performed in the four environments:
(Movies are encoded in mpeg format)