Supporting material for the paper:
Evolution of Signalling in a Multi-Robot System:
Categorisation and Communication
by Christos Ampatzis, Elio Tuci, Vito Trianni, and Marco Dorigo
December 2006
Real Robot Experiments:
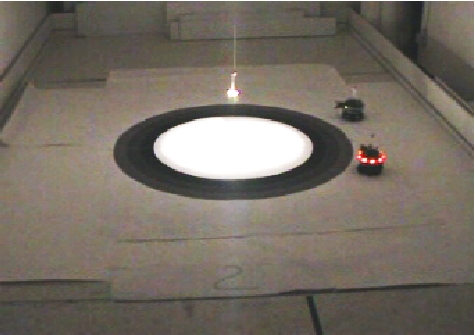 |
Below are sample movies from the experiments performed in the arena above:
Experiments with 2 robots.
Movies are encoded in wmv format.
Experiments with 4 robots.
Movies are encoded in mpeg format.
All videos recordings from all the trials can be accessed at:
http://www.swarm-bots.org/integration-over-time.html
Experiments in simulation are performed with two robots and in
reality with two and four robots. Movies are taken from an overhead
camera and a hand camera and are encoded in .mpg or .wmv
formats. Notice that when the robots emit a sound signal we light
their colour turret red for visualisation purposes.
The behaviour of the group for the two robots is analysed in the
paper. Concerning the four robots experiment, the results are almost
perfect. In one trial though, sbot5 while performing antiphototaxis as
a reaction to the sound emitted by sbot3, made a turn of 180 degrees
and started moving wrongly towards the light. In all other trials
though we did not observe this error and it looks to be a hardware
crash. Another error
which was not expected and revealed some property of our controller
about which we would not have found out had we not performed the four
robot test, is the fact that the robot-robot avoidance behaviour does
not work while the robots perform antiphototaxis. In fact, as they
leave the band after they perceive a sound signal, their sensorial
input is ignored, with the consequence that in case they encounter
another agent on their way, they collide against each other. A
possible explanation for this is that this condition was never
encountered during evolution, and therefore the mechanism shaped was
confined to just leaving the band without paying attention to
obstacles (other robots). Finally, by allowing more agents to interact
in the target area, we discovered that the robot-robot
avoidance mechanism is different once the robots are interacting
there---a case not often encountered during the two robot
experiments--and can be described as follows: if an agent detects
others in its vicinity, it stops and spins until the other agents have
moved away.
Neuron Graphs and Lesion Analysis:
Plot of the firing rate of all neurons with time for a robot of g2 (red continuous lines) and g10 (blue dashed lines)
| 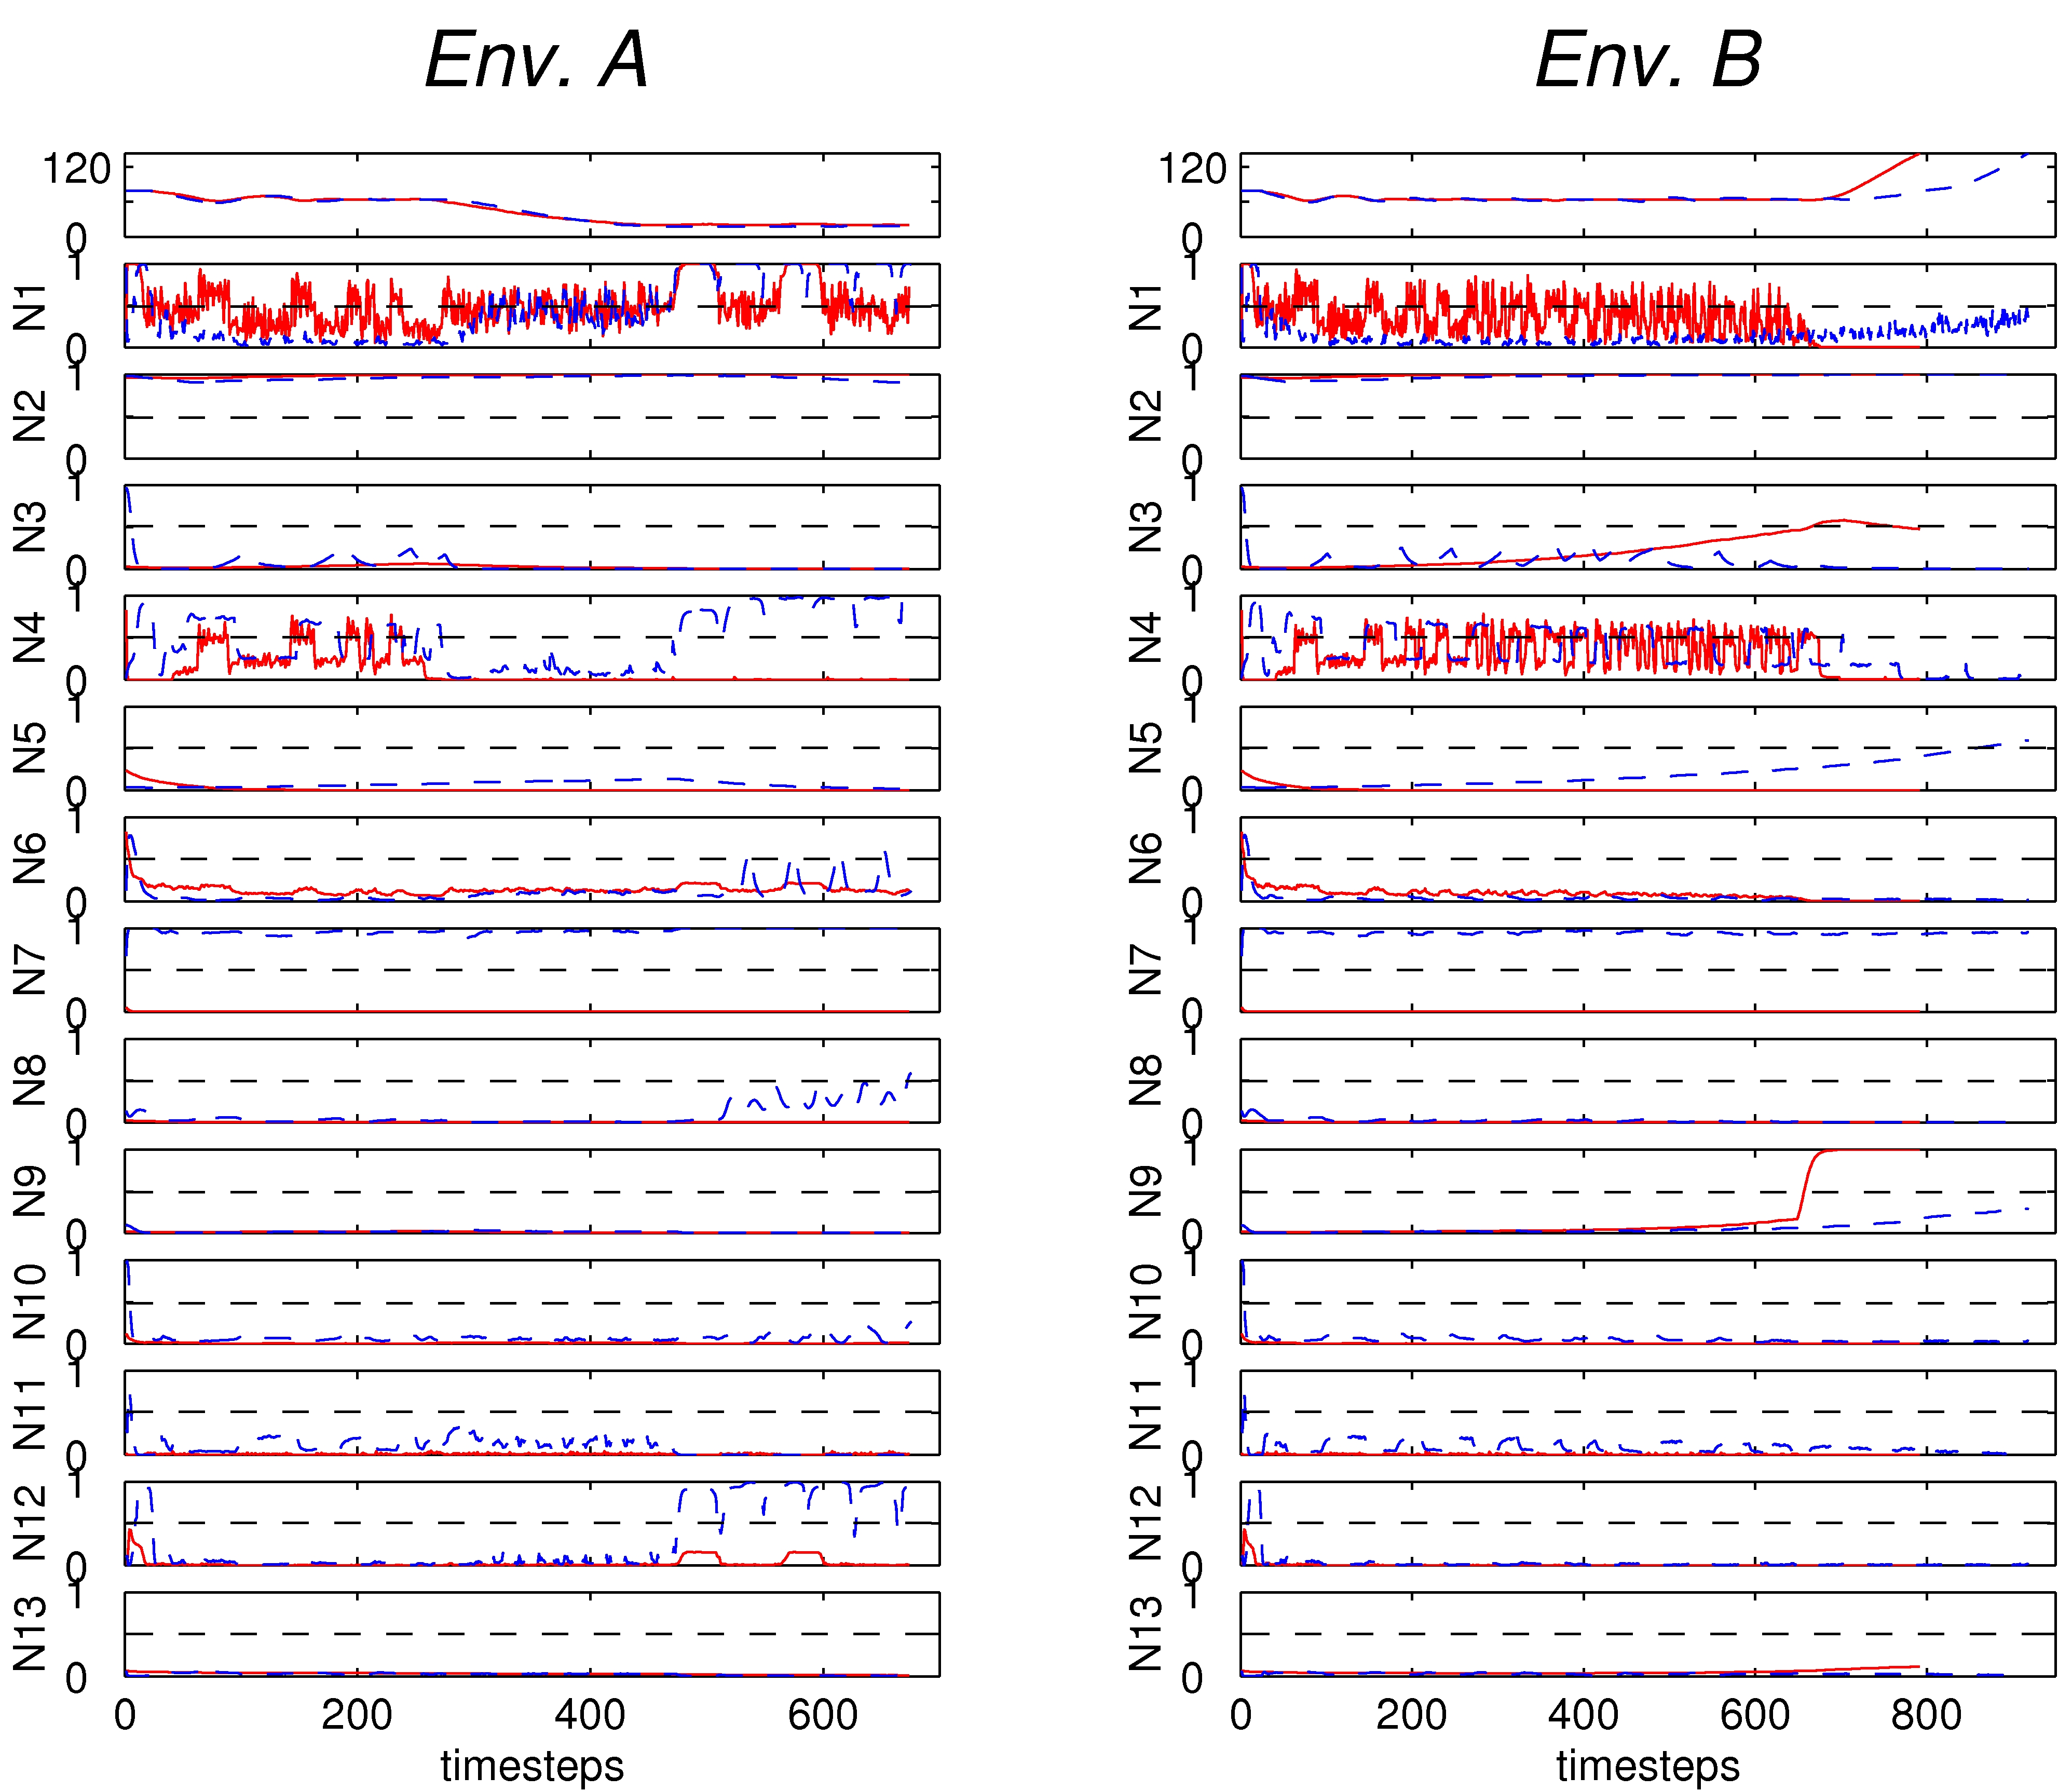 |
In the case of a robot of a signalling group (e.g., g2), we have seen
in the paper that the output of N13 (sound output) is integrating the
information over time by rising and passing over the threshold of 0.5
when the discrimination is performed. But since this is not the case
for non-signalling groups (e.g., g10), we should look elsewhere to
find a neuron that performs the integration. Therefore, in the Figure
above we plot the firing rates of all the neurons of the network, for
one robot of groups g2 and g10, over time for both environments,
during a successful trial (this we do because we are interested in
discovering a mechanism that goes beyond a certain threshold in the
case of Env. B---bringing forth the discrimination, while it
stays below this threshold for Env. A). Notice that these
values are not passed through the sigmoid function, that is why the
plot for N13 is different than the one in the paper (in the paper we
plot the sound output (cell potential passed through the sigmoid
function). We notice that for group g2 there is N3 (that takes input
from one floor sensor) whose firing rate's evolution through time has
the characteristics defined above: starts rising (from 0) when the
robots start circling around the band (approximately constant distance
to light) and, in case the way-in zone is encountered, stops
rising and starts decreasing, in case the agent is in Env. B,
it passes beyond the threshold of 0.5. Immediately after we notice
that the robot is leaving the band. This suggests that there is also
an internal integration mechanism, apart from the one present in the
activation of the sound output neuron. Concerning the behavior of the
robot of group g10, the neuron that plays this role is N5 (that takes
input from a combination of proximity sensors). To prove that these
neurons are indeed essential for the discrimination to take place, we
introduce lesions in the robot controllers which selectively damage
the functionality of one neuron at a time. Specifically, we confine
the value of the firing rate of a neuron to the average value observed
throughout the robots lifetime and we re-evaluate the system with the
new conditions. We are interested in discovering the functionality of
each neuron in the network and also which neurons are indeed tied to
the discrimination mechanism. The Table below gives us the results of
this lesion analysis, by displaying the average final distance of the
two agents over 500 evaluations in Env. A and 500 in
Env. B, for g10 and g2. What we notice is that indeed N3 is
the integration neuron for g2 and N5 for g10, and without them the
robots are unable to trigger antiphototaxis (the average distances for
Env. A suggest that they do find the way-in zone,
while for Env. B that they stay on the band). Furthermore,
the numbers suggest that one light sensor is enough to solve the task,
since the disruption of N2 (the second light sensor) does not make the
group unsuccessful. For g2, the sound input and output neurons are
essential to complete the task in Env. B. What is surprising
though is that if N9 (sound input neuron) is disturbed, g10's
performance gets disrupted, despite the fact that as we saw this
genotype does not rely on the presence of sound to trigger
antiphototaxis. In detail what happens is that the disruption prevents
robots from performing antiphototaxis in Env. B, while they
are able to find the way-in zone in Env. A).
Lesion Analysis Table
|  |
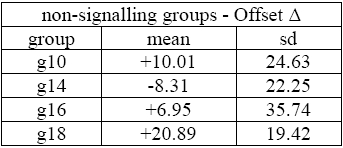
Offset &Delta of successful groups
Table showing Offset &Delta of successful signalling groups of Table 1 of the paper
|  |
Table showing Offset &Delta of successful non-signalling groups of Table 1 of the paper
|  |
Statistics in Env.A
Table showing the statistics complementing Table 4 of the paper - statistics of post-evaluation tests in Env.A
| 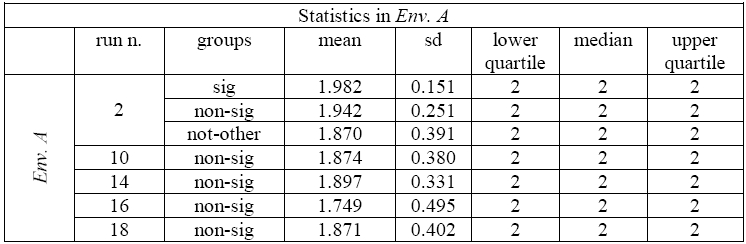 |