Mission A
Mission B
Mission C
Mission D
Mission E
Jeanne Szpirer, David Garzón Ramos, and Mauro Birattari (March 2024)
|
Table of Contents |
Typically, automatic design of robot swarms generates control software by maximizing a performance measure that specifies the mission of interest. Defining an appropriate performance measure is a non-trivial task that requires attention from an expert. Recently, inverse reinforcement learning was used to automatically design robot swarms starting from specifications provided via demonstrations of the desired behavior, rather than via a performance measure. In this paper, we propose a framework based on inverse reinforcement learning and multi-criteria optimization to enable the automatic design of robot swarms that can perform sequences of missions specified via demonstrations.
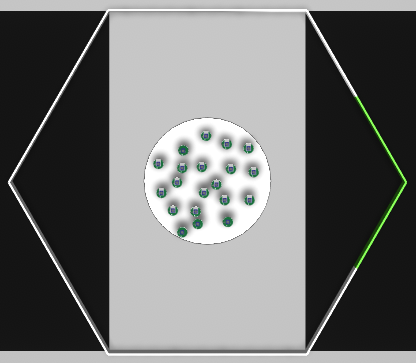
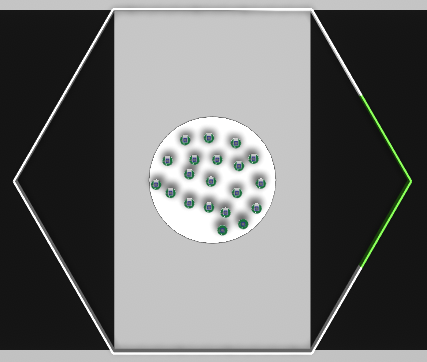
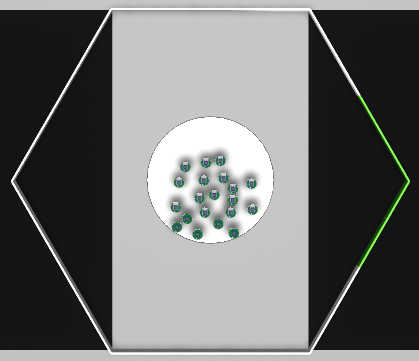
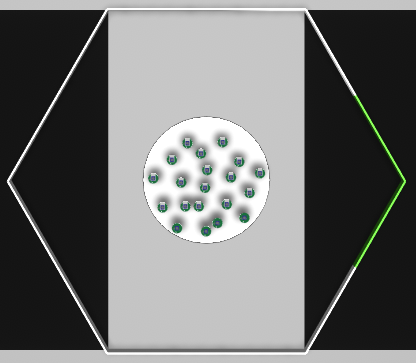
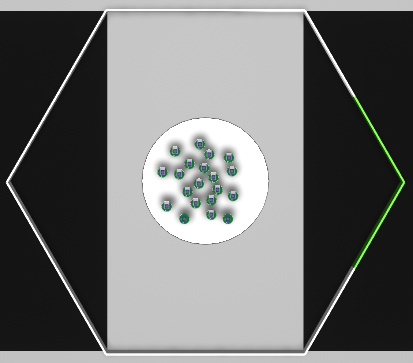
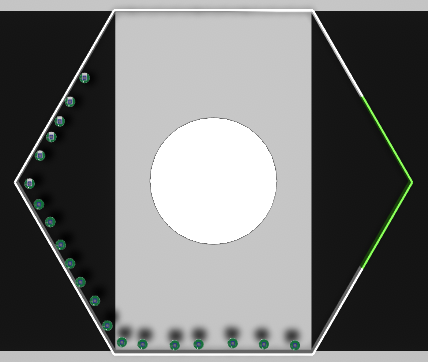
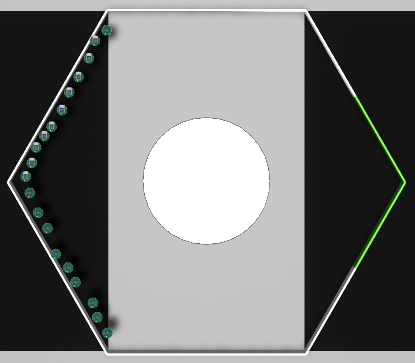
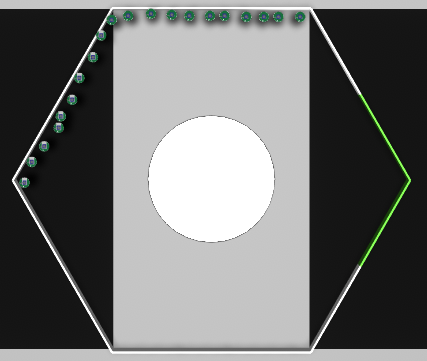
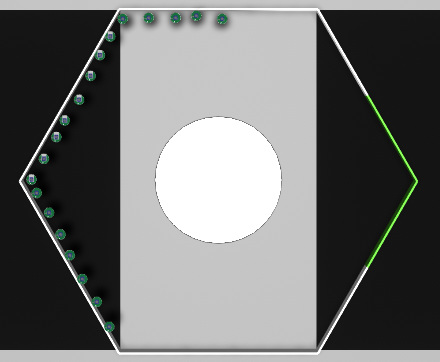
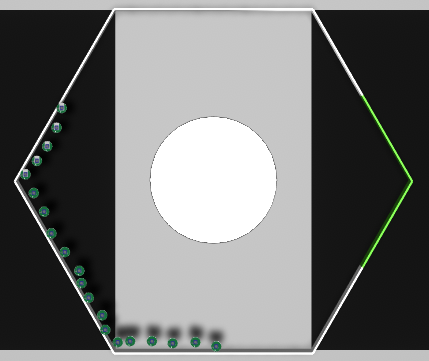
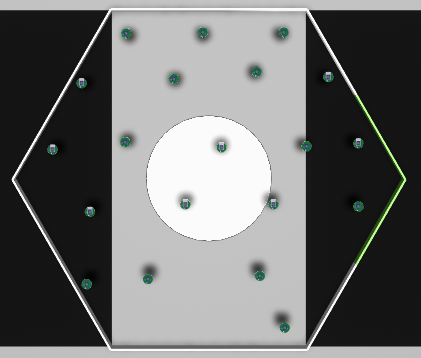
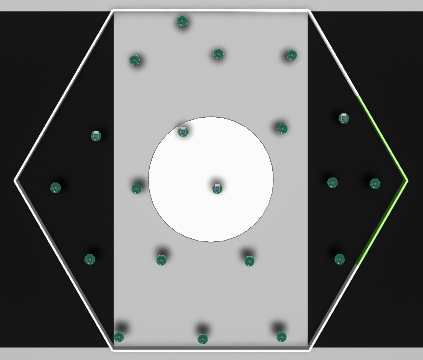
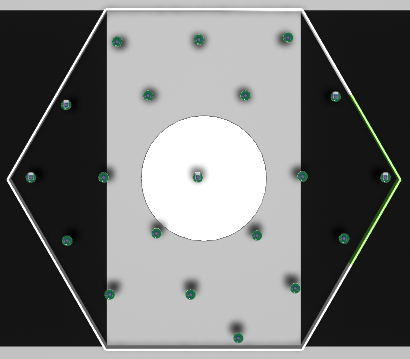
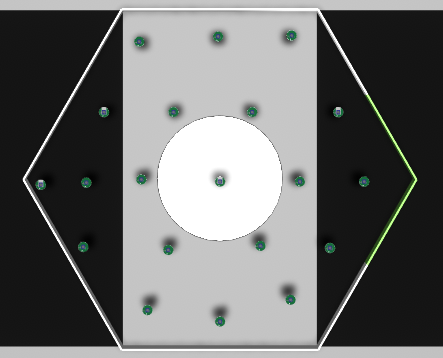
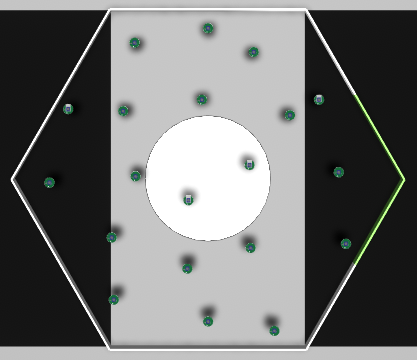
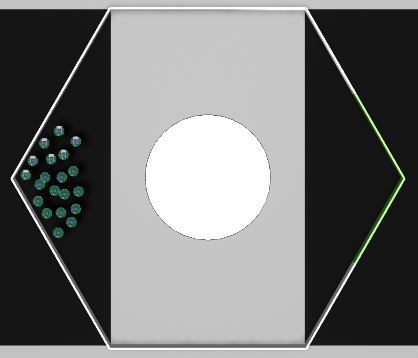
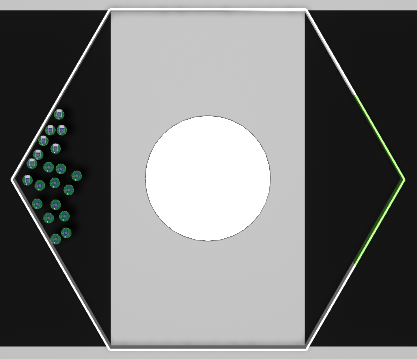
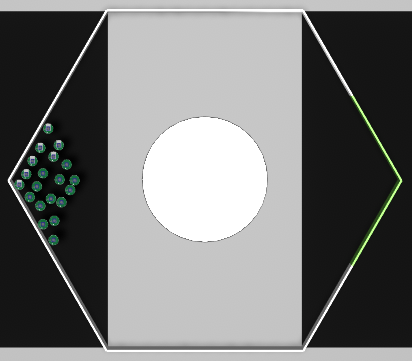
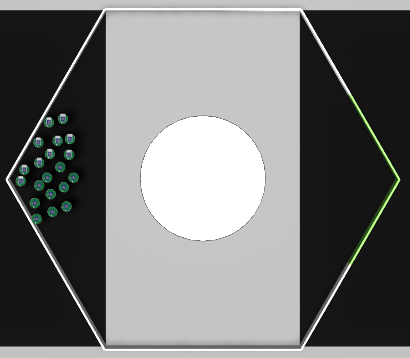
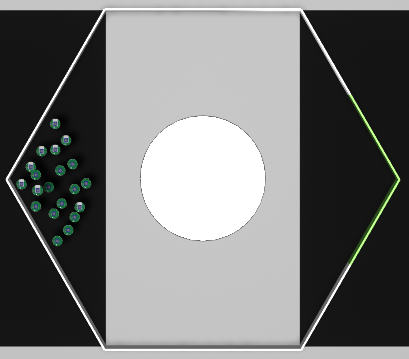
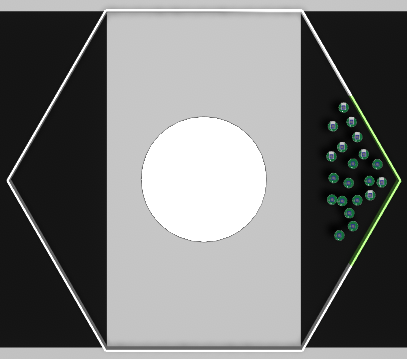
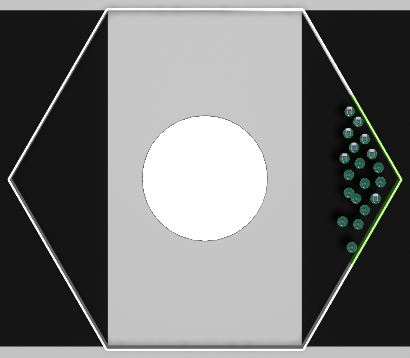
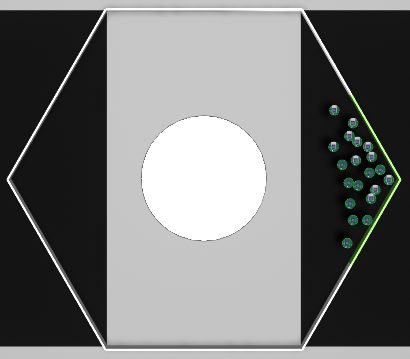
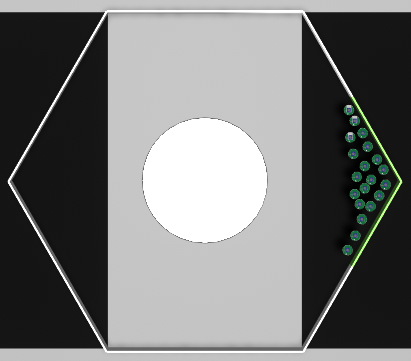
Below are the five demonstrations per mission that were provided to Demo-Fruit to design the control software.
Mission A |
||||
|
|
|
|
|
Mission B |
||||
|
|
|
|
|
Mission C |
||||
|
|
|
|
|
Mission D |
||||
|
|
|
|
|
Mission E |
||||
|
|
|
|
|
Below are the detailed information needed to fully understand the learning and optimization process for each mission.
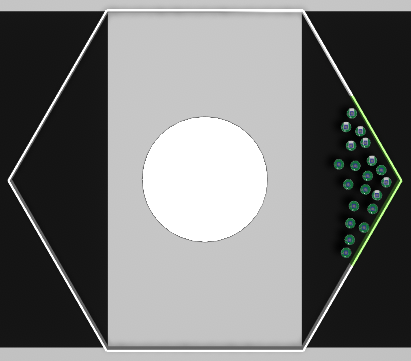
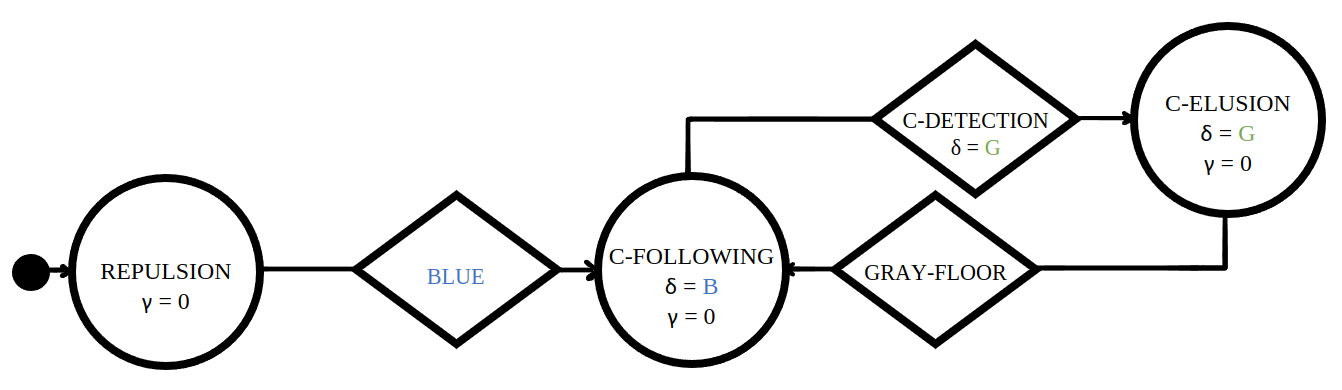
Mission C·B |
|
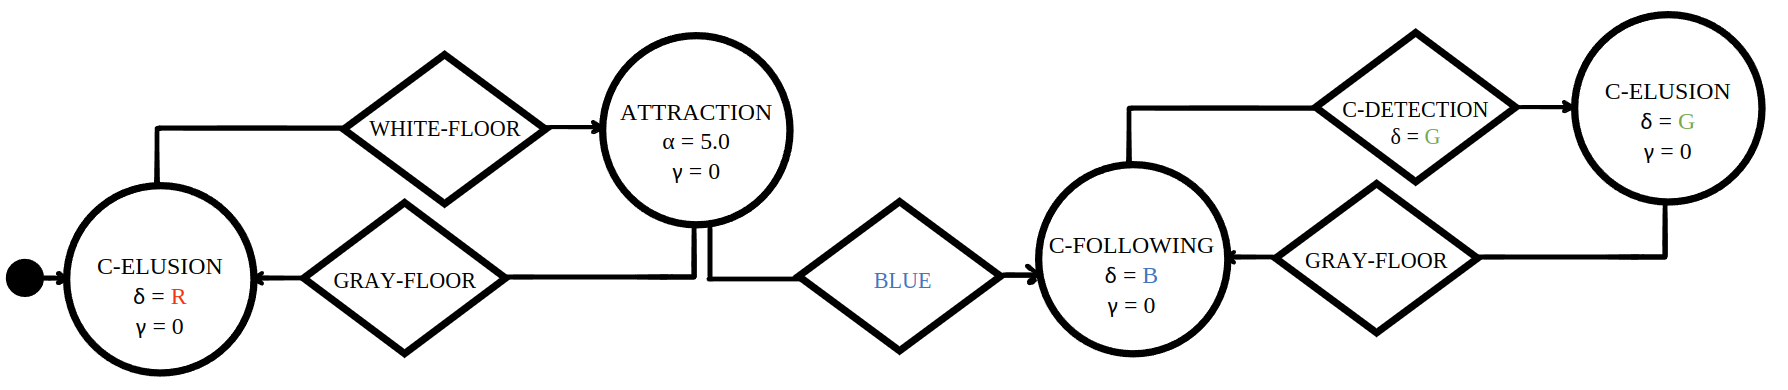
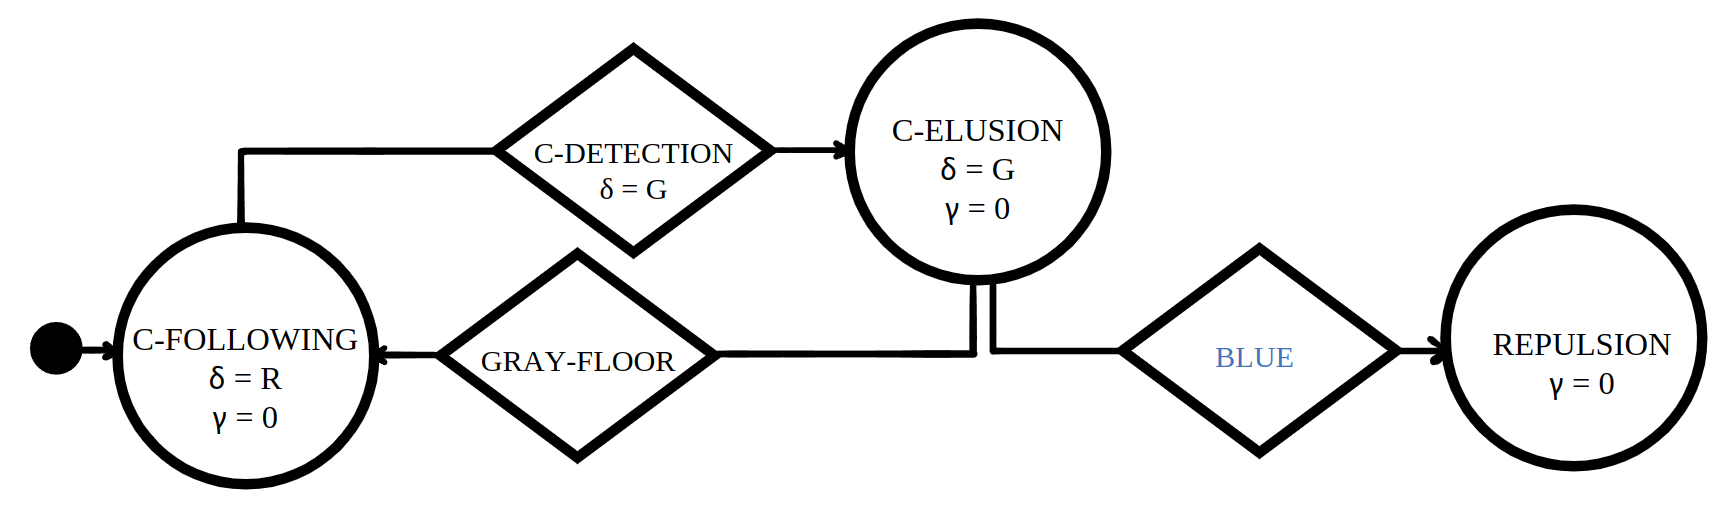
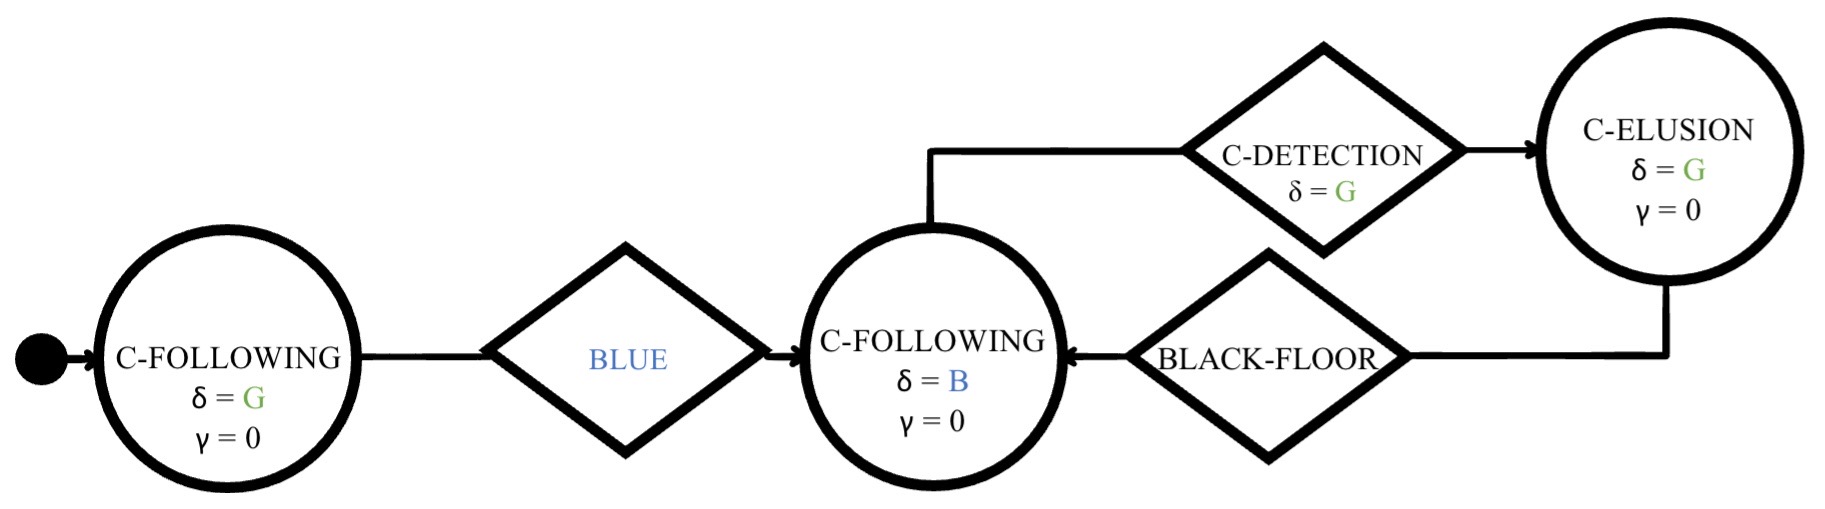
Baseline control software |
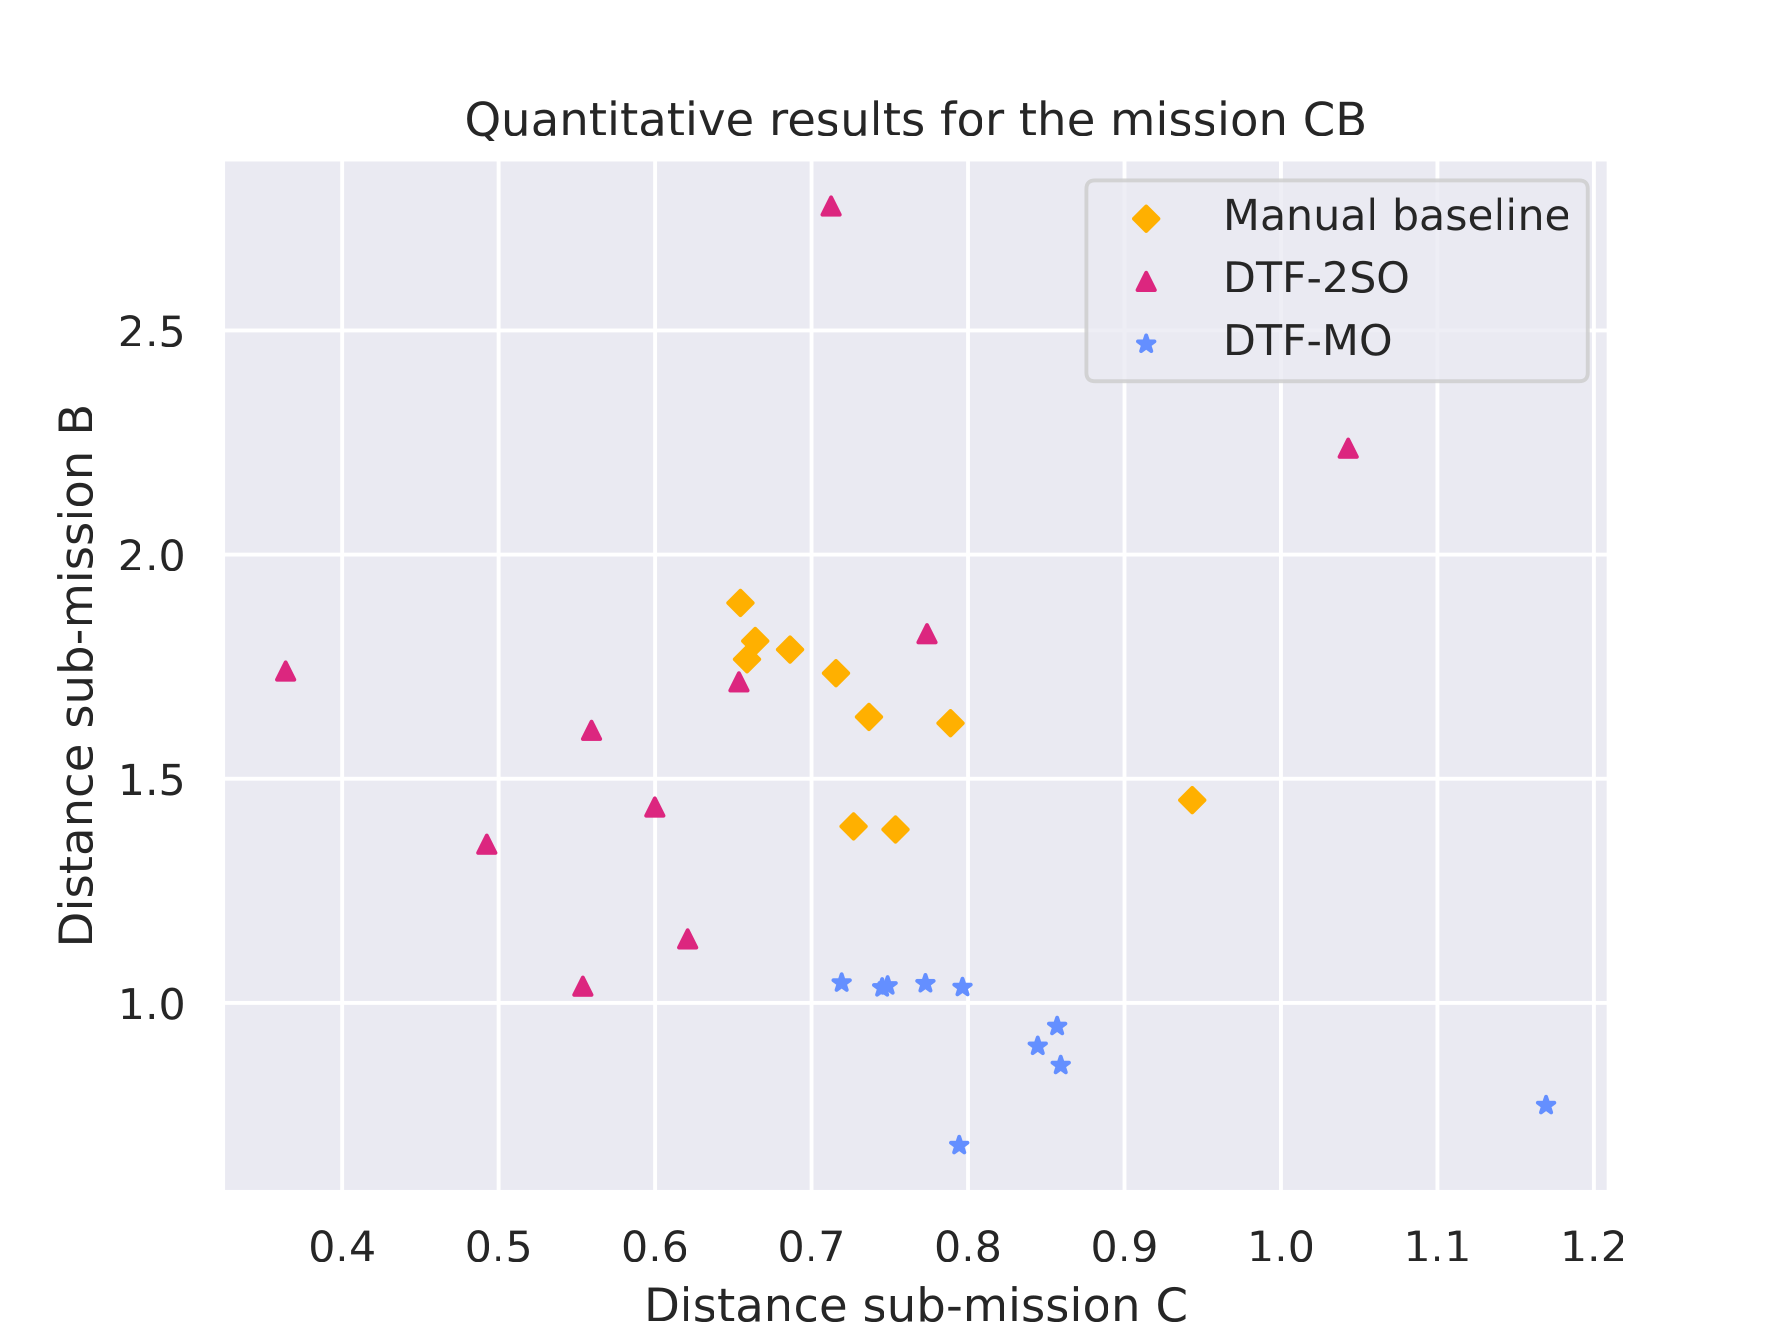
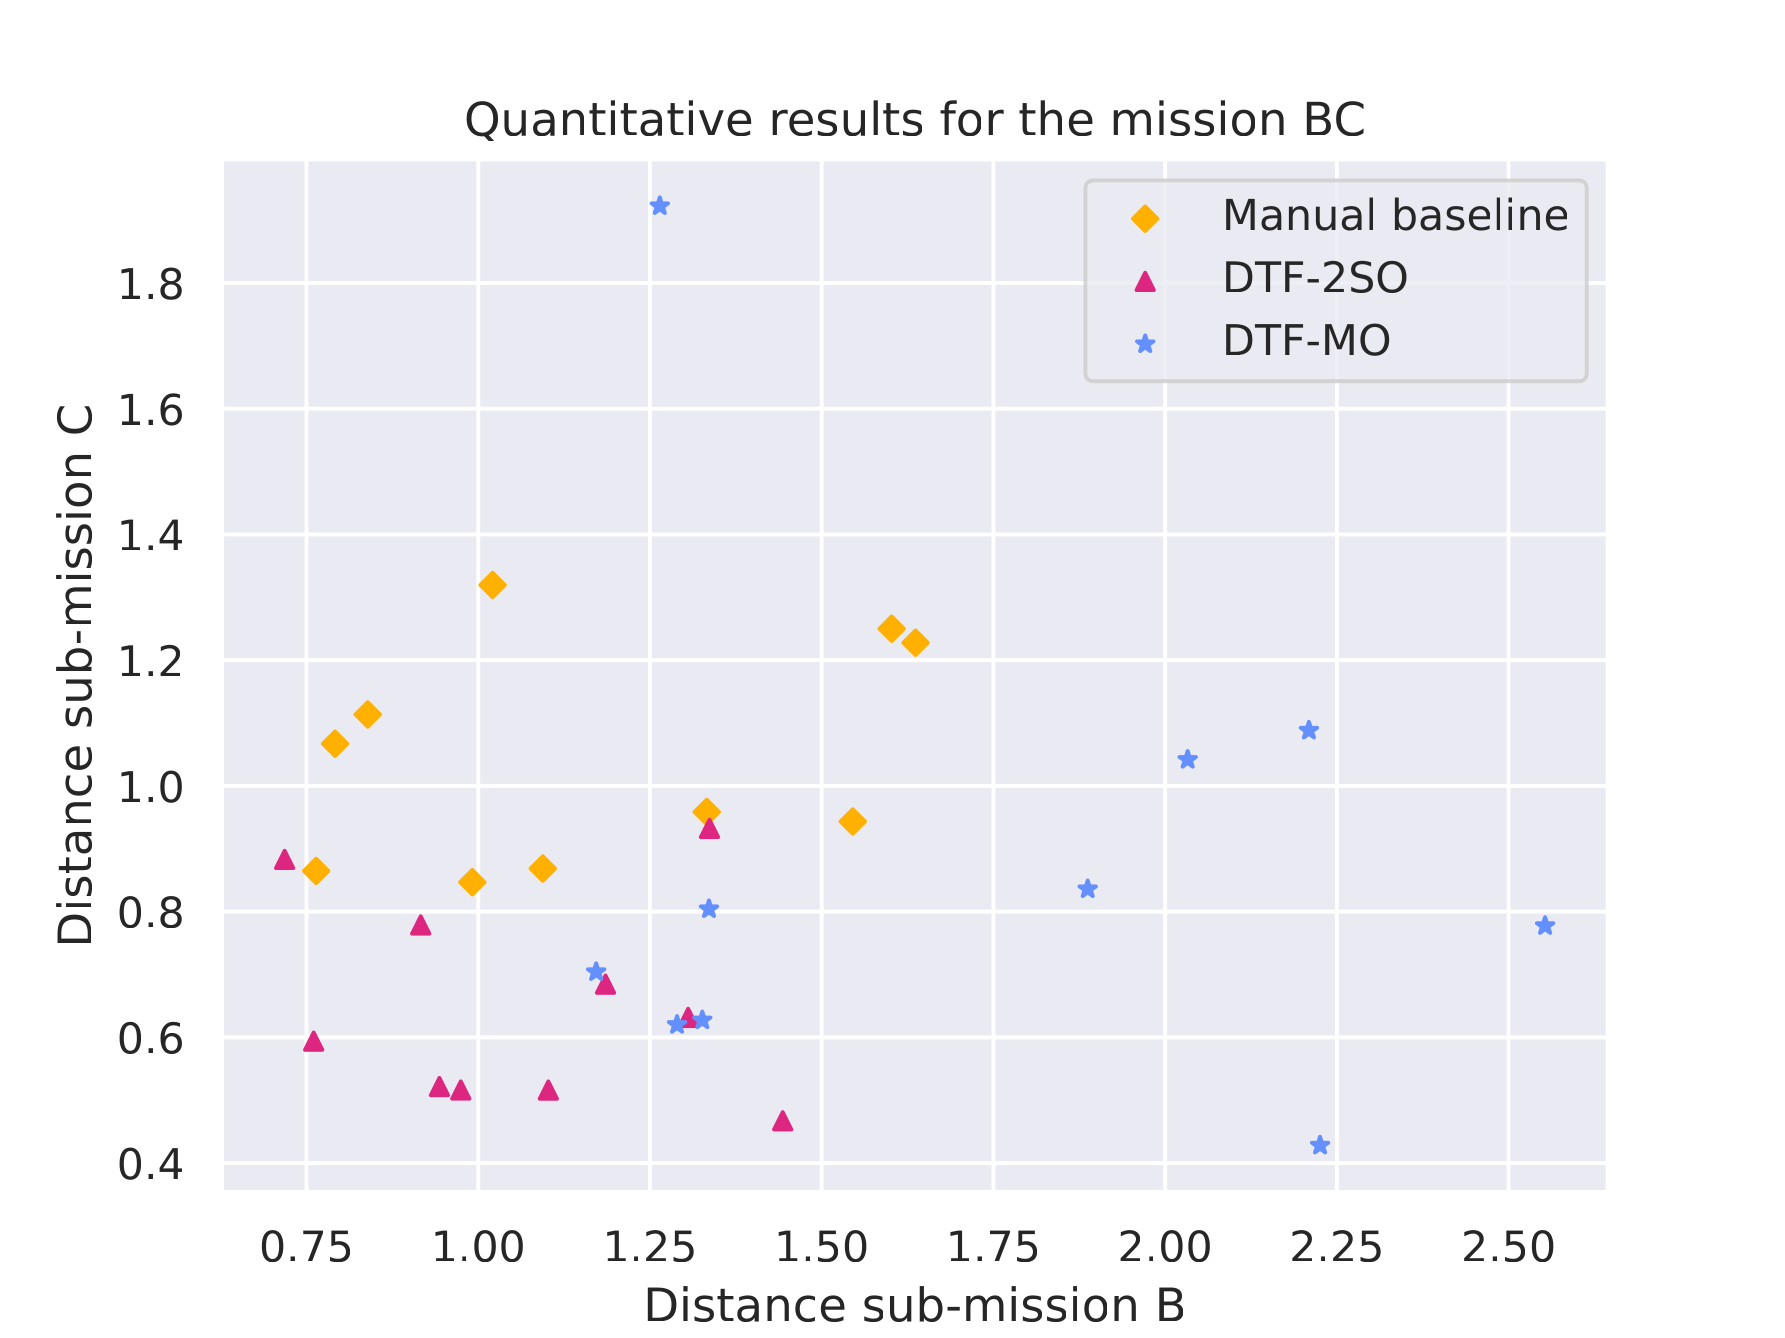
Quantitative results |
 |
 |
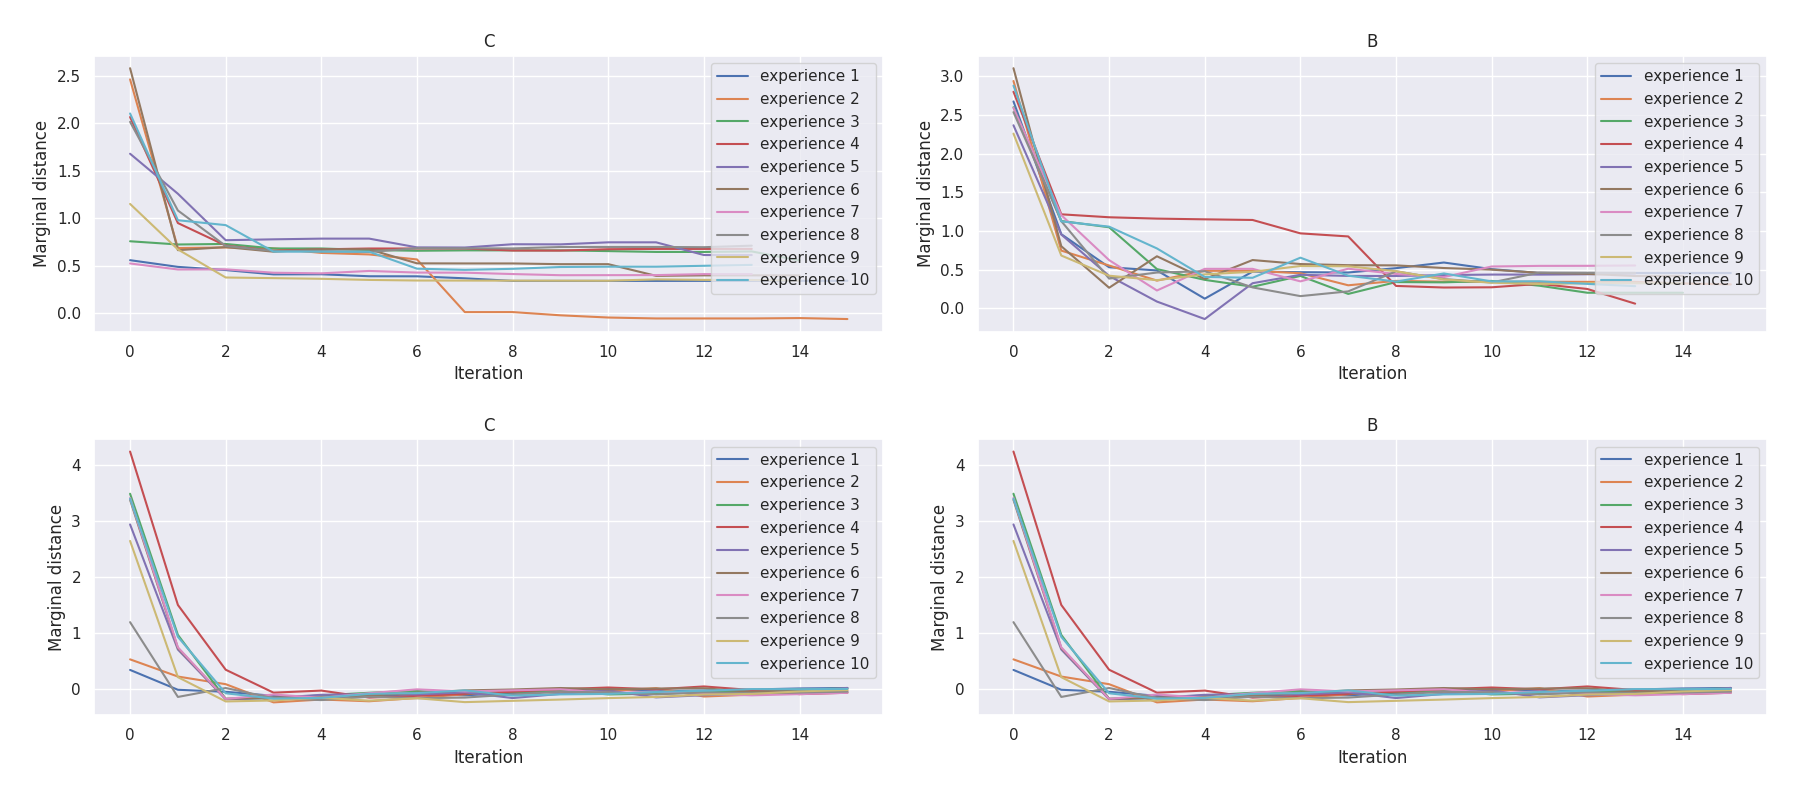
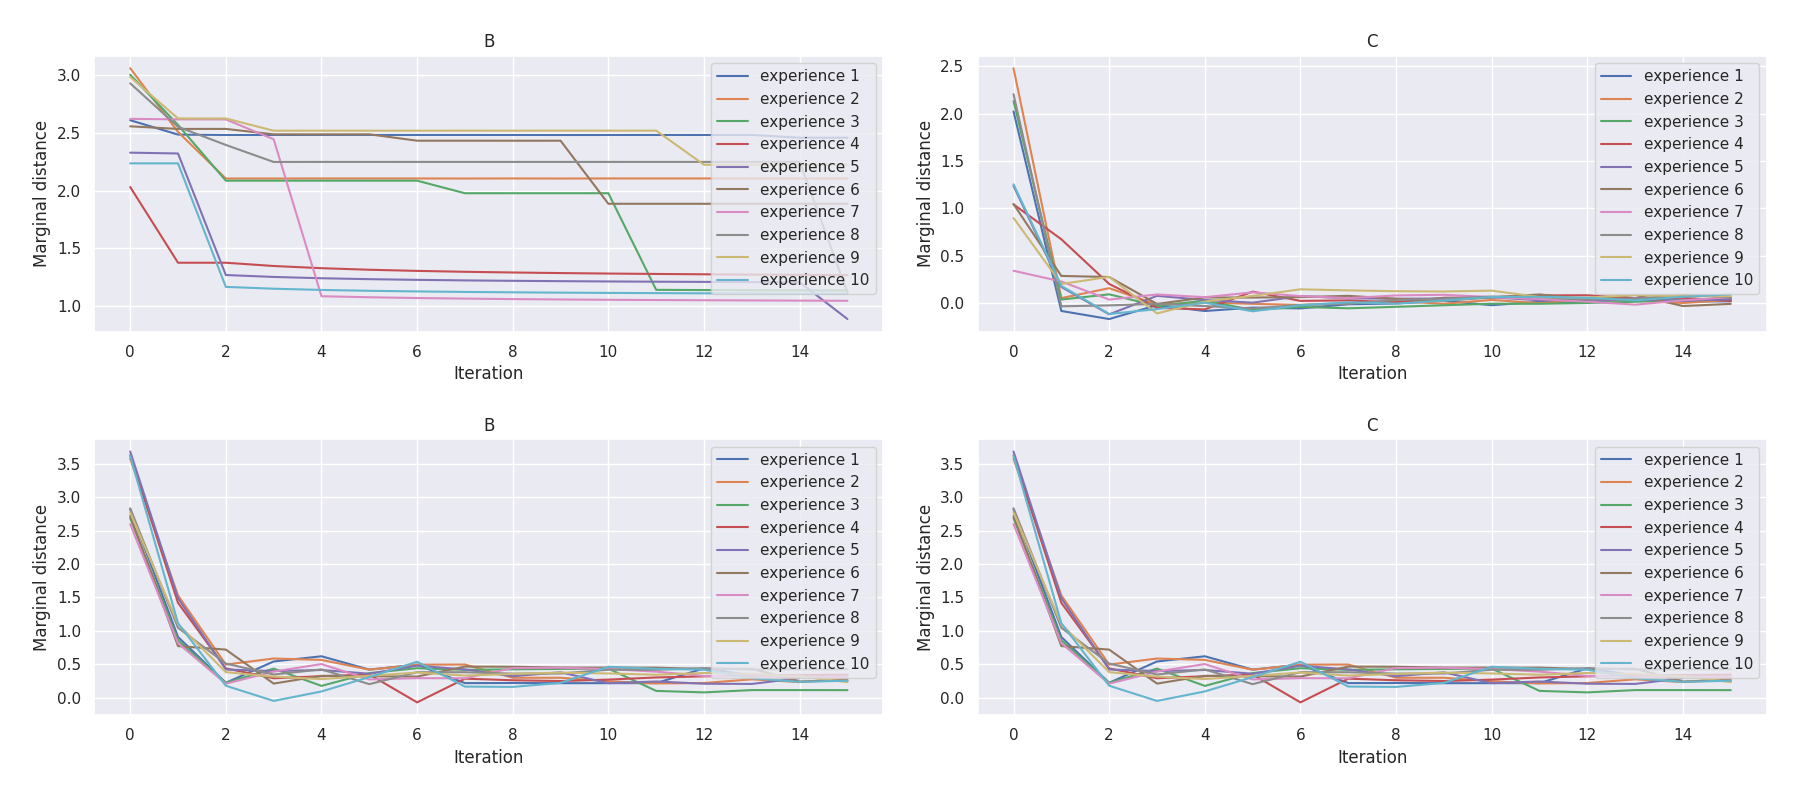
t-plots: DTF-MO (top), DTF-2SO (bottom) |
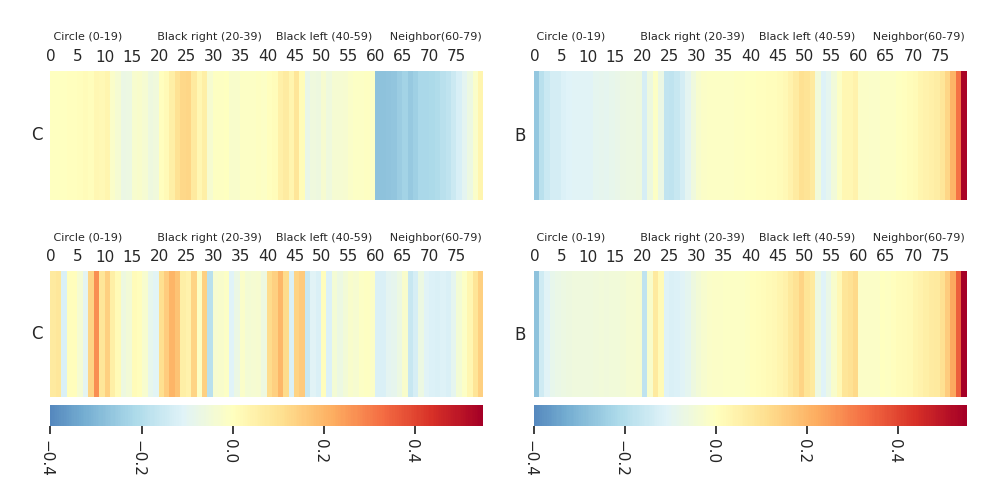
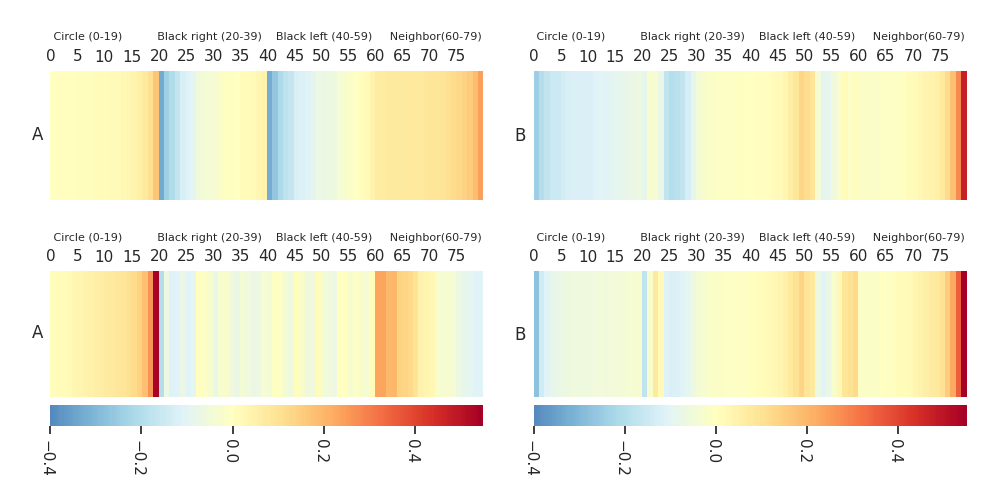
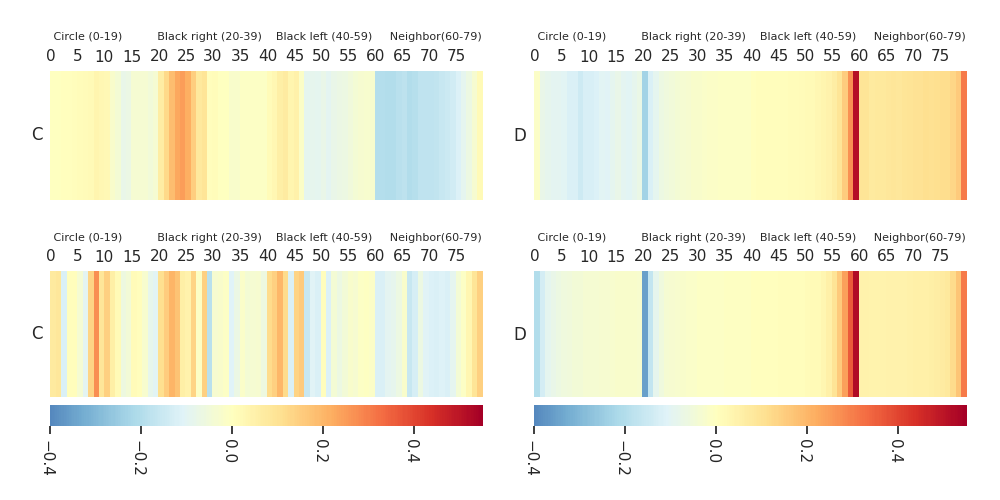
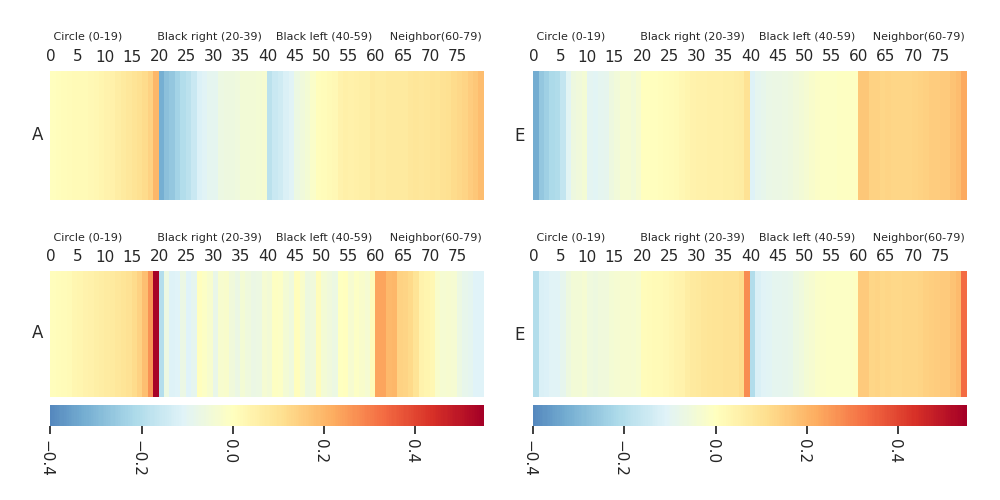
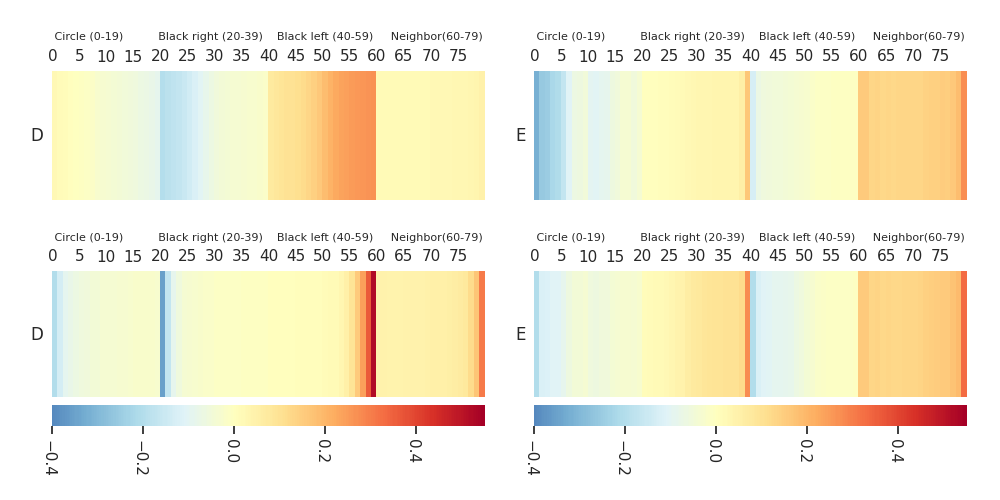
Heatmaps: DTF-MO (top), DTF-2SO (bottom) |
 |
 |
Mission A·B |
|
Baseline control software |
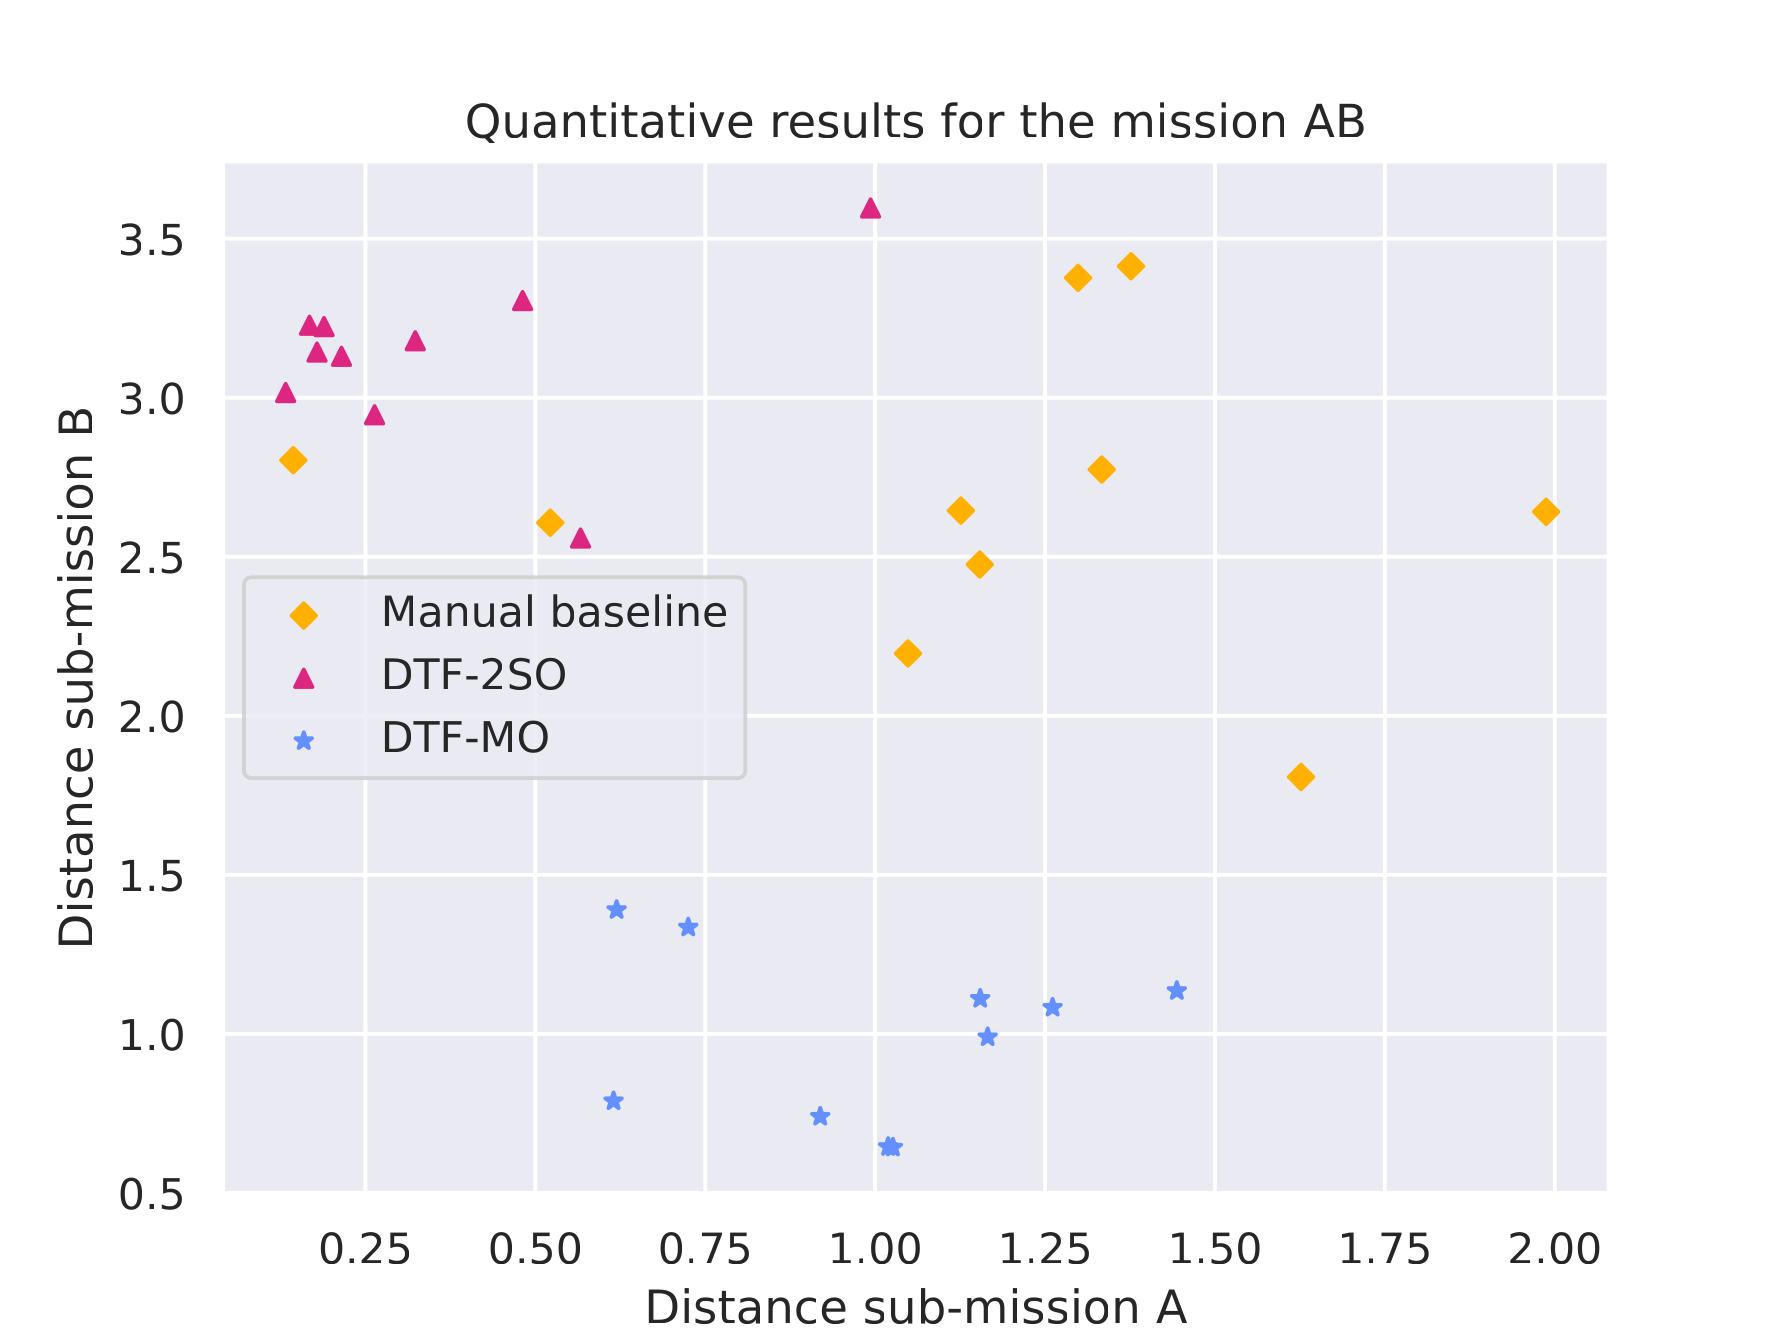
Quantitative results |
 |
 |
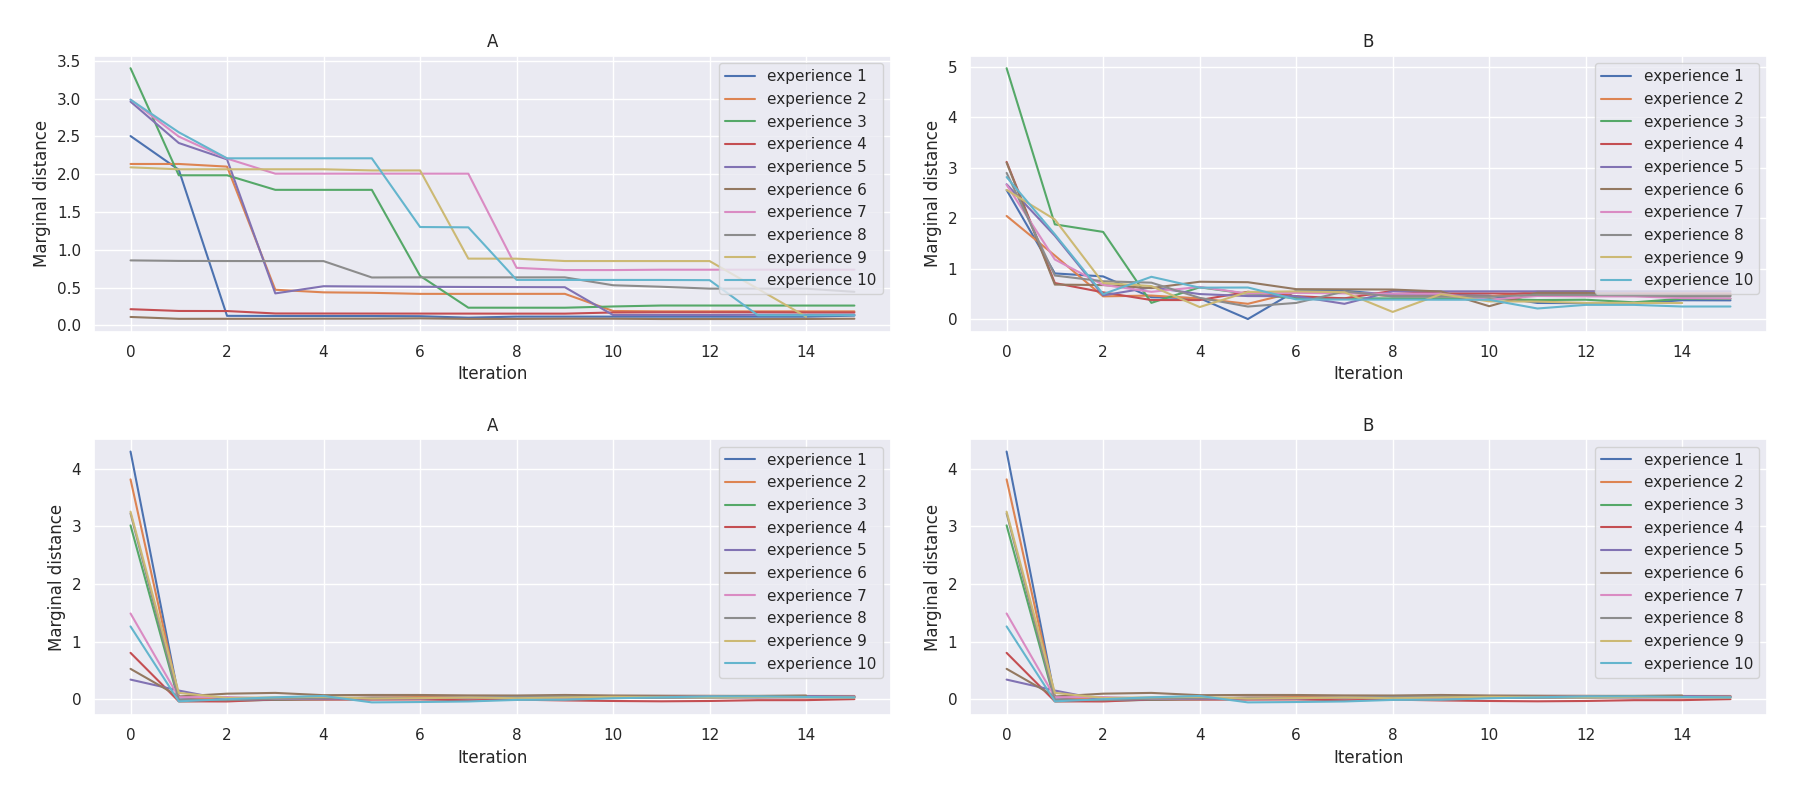
t-plots: DTF-MO (top), DTF-2SO (bottom) |
Heatmaps: DTF-MO (top), DTF-2SO (bottom) |
 |
 |
Videos to show that in SUB-MISSION A of mA·B with DTF-MO, the robots do not exactly aggregate in the center of the arena—as indicated in the demonstration. Instead, they remain near the borders of the white circle to perceive the walls more easily and react promptly to the cue. |
With DTF-2SO, robots get trapped in the circle because they do not perceive the walls. |
Mission B·C |
|
Baseline control software |
Quantitative results |
 |
 |
t-plots: DTF-MO (top), DTF-2SO (bottom) |
Heatmaps: DTF-MO (top), DTF-2SO (bottom) |
 |
 |
Mission C·D |
|
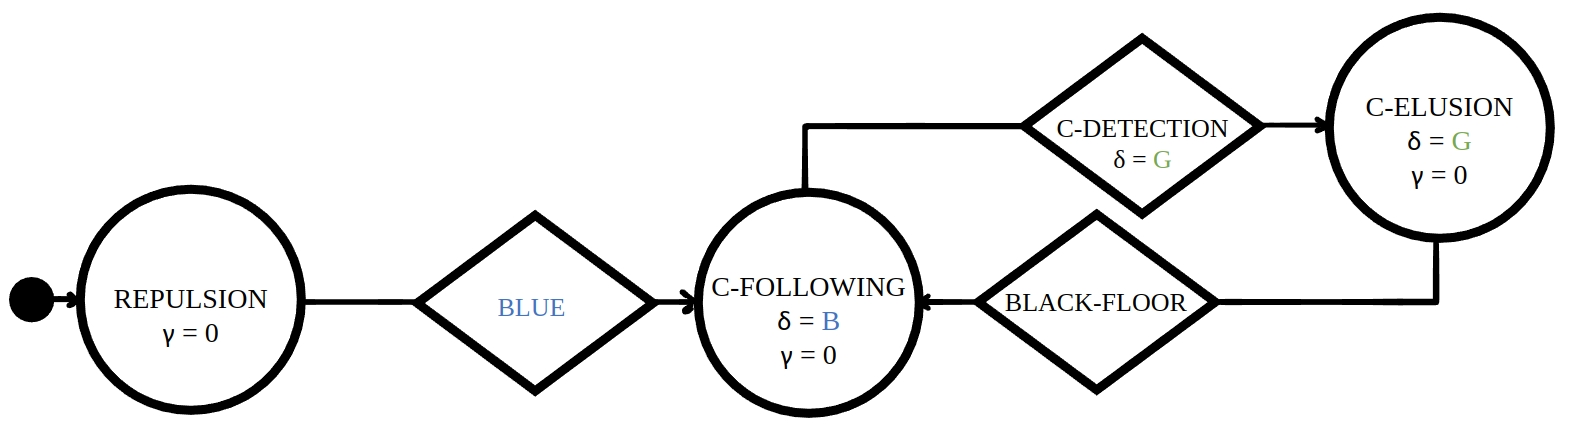
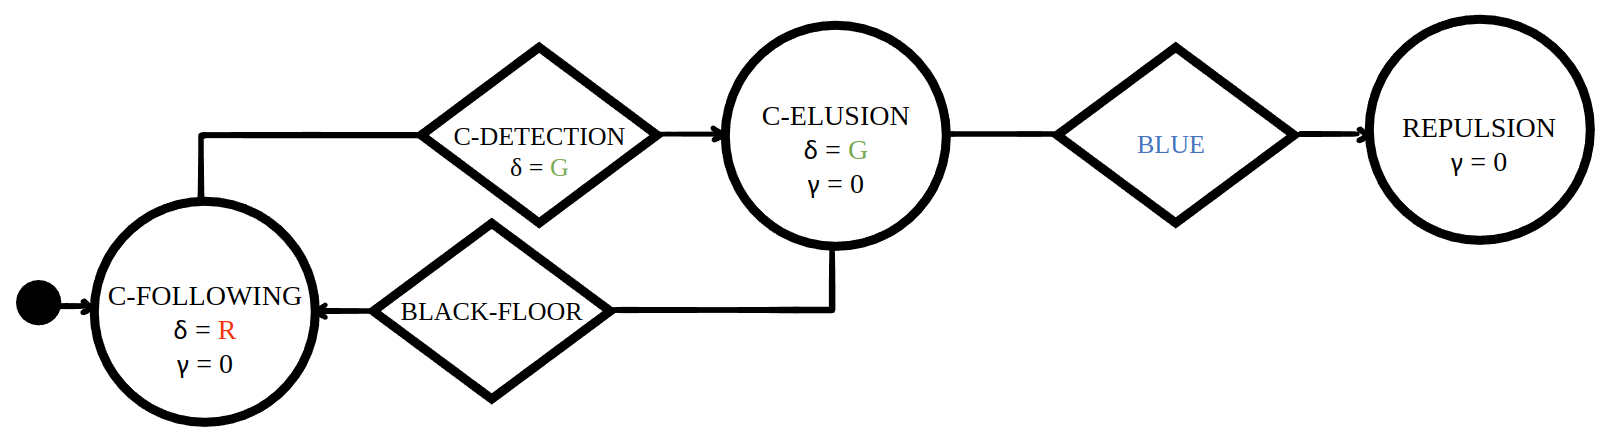
Baseline control software |
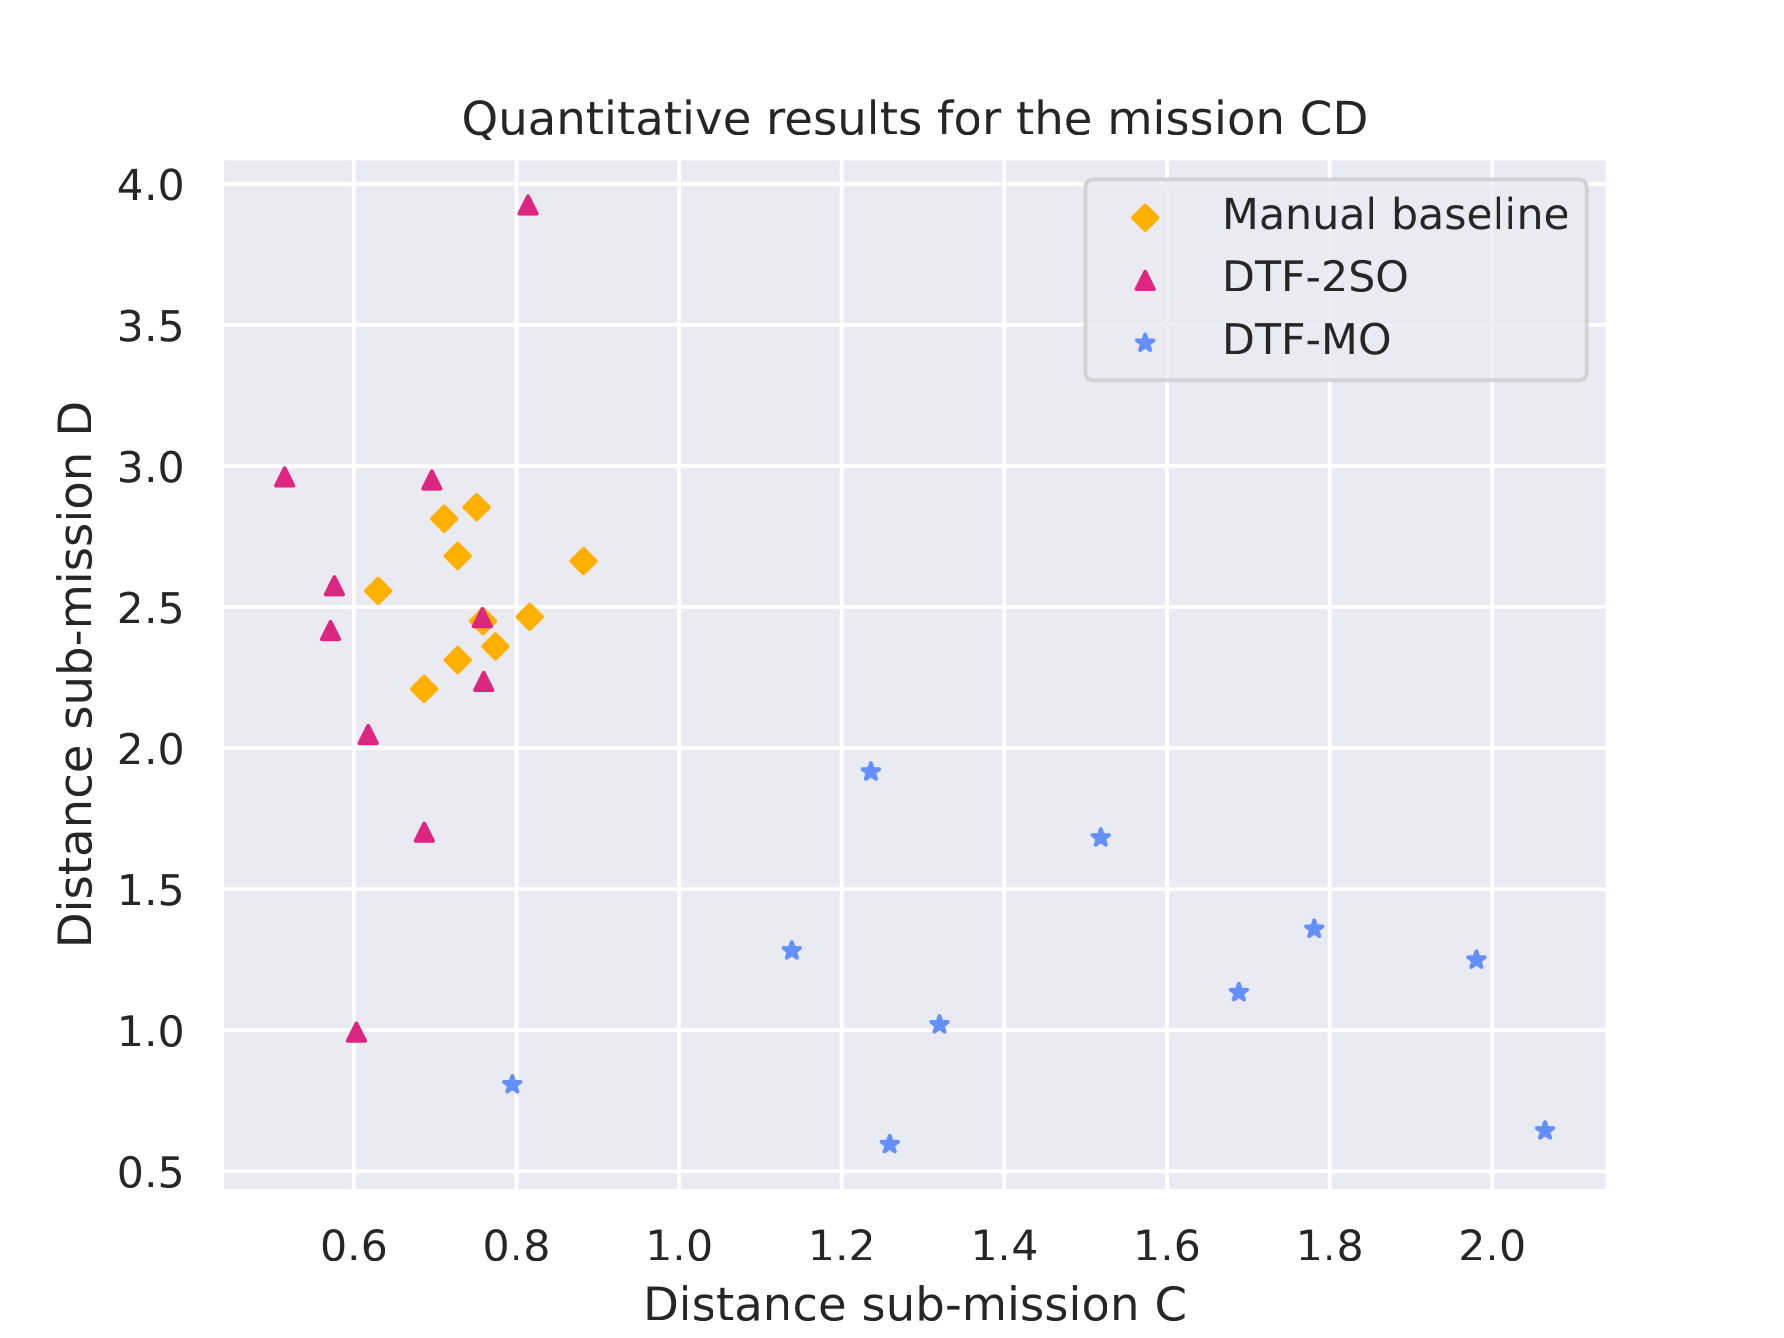
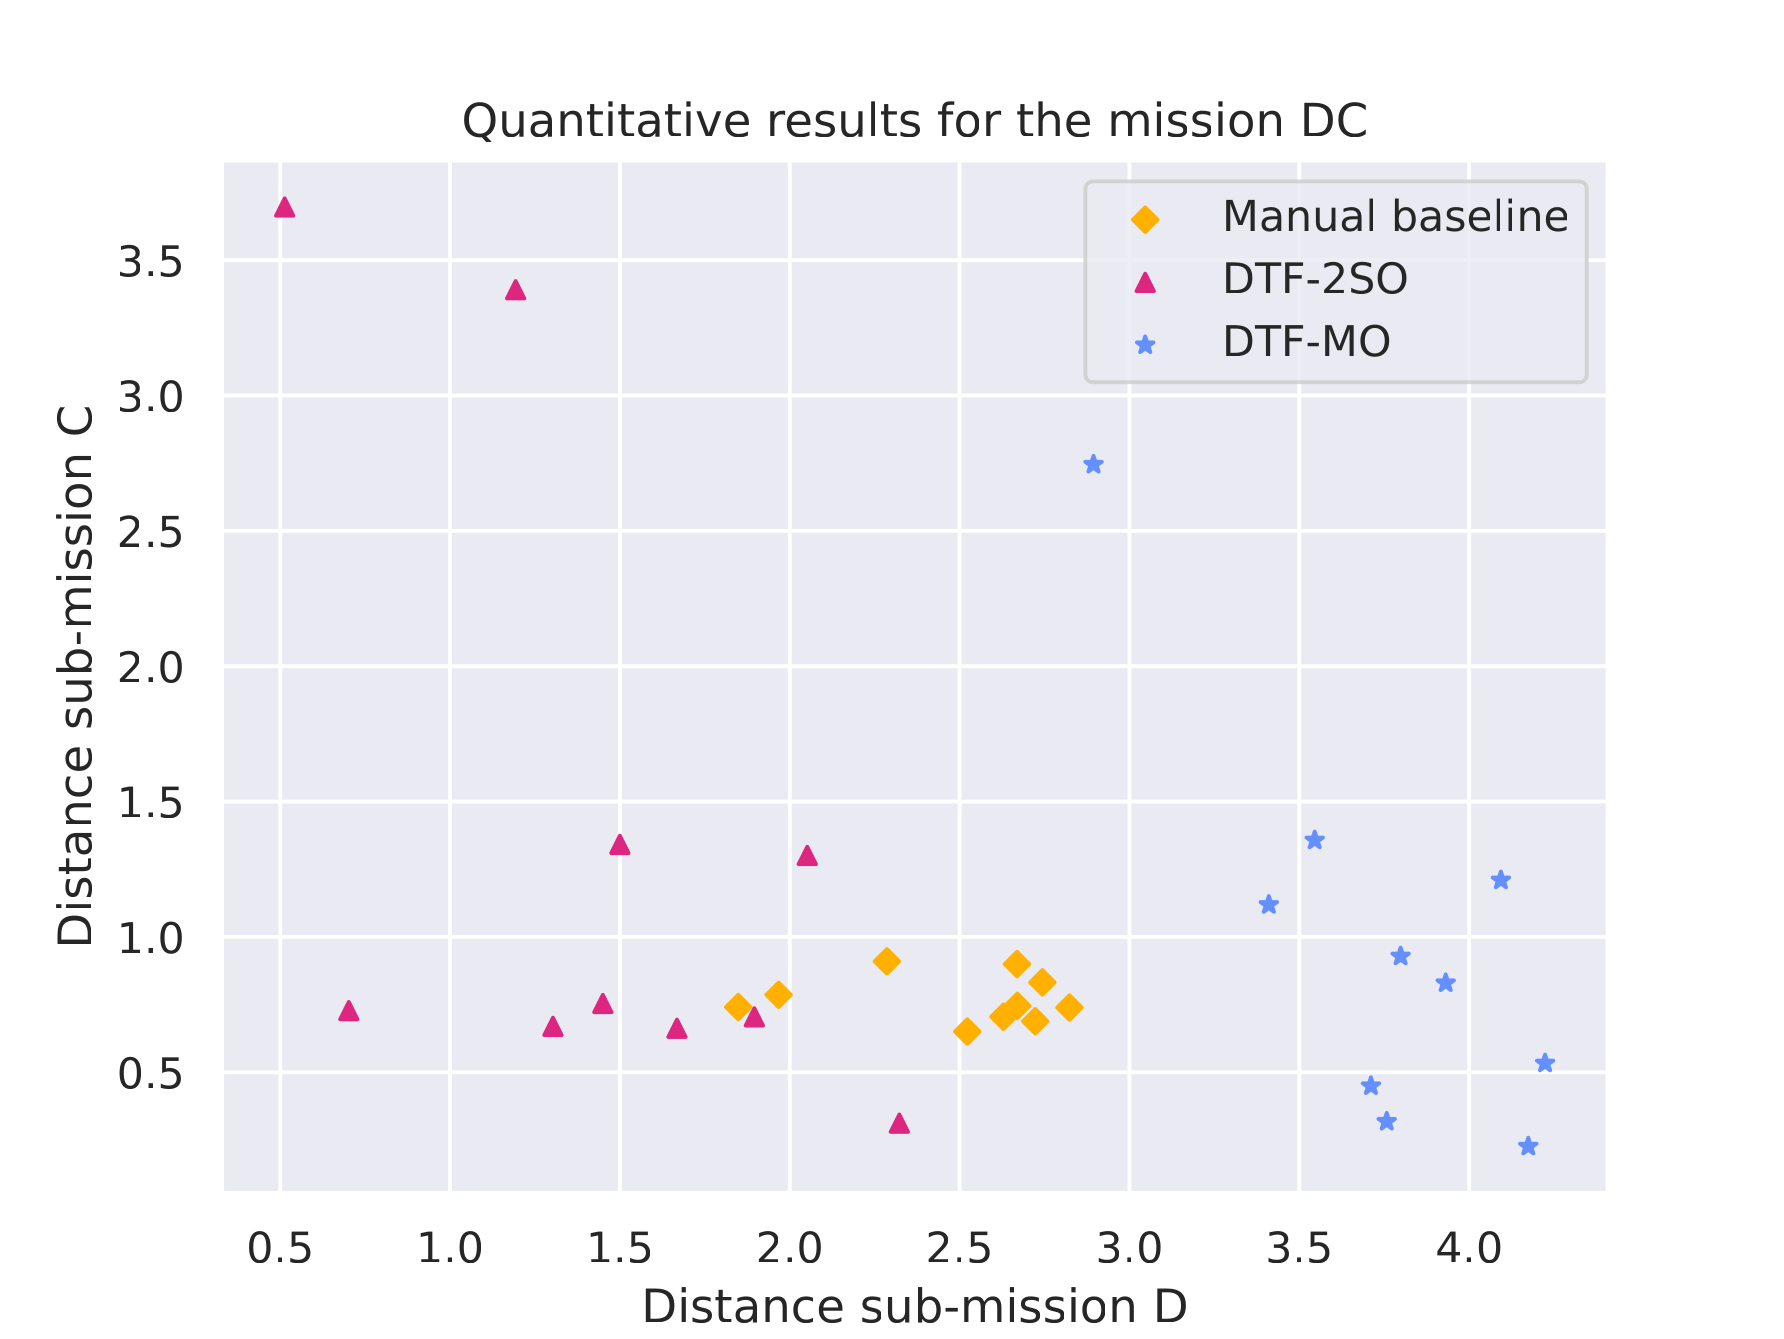
Quantitative results |
 |
 |
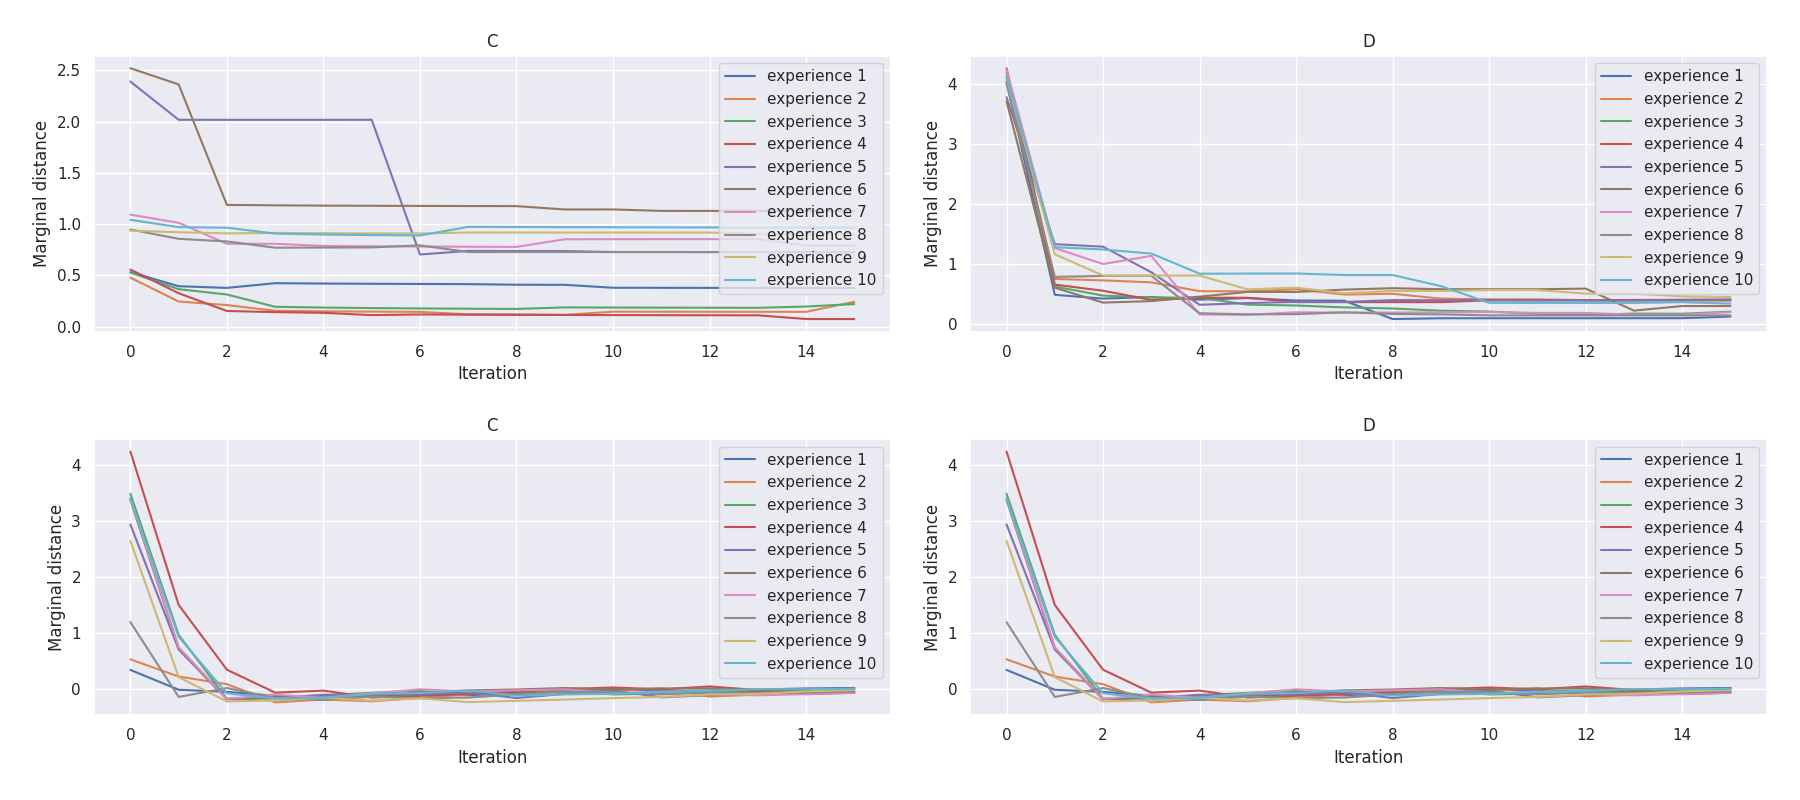
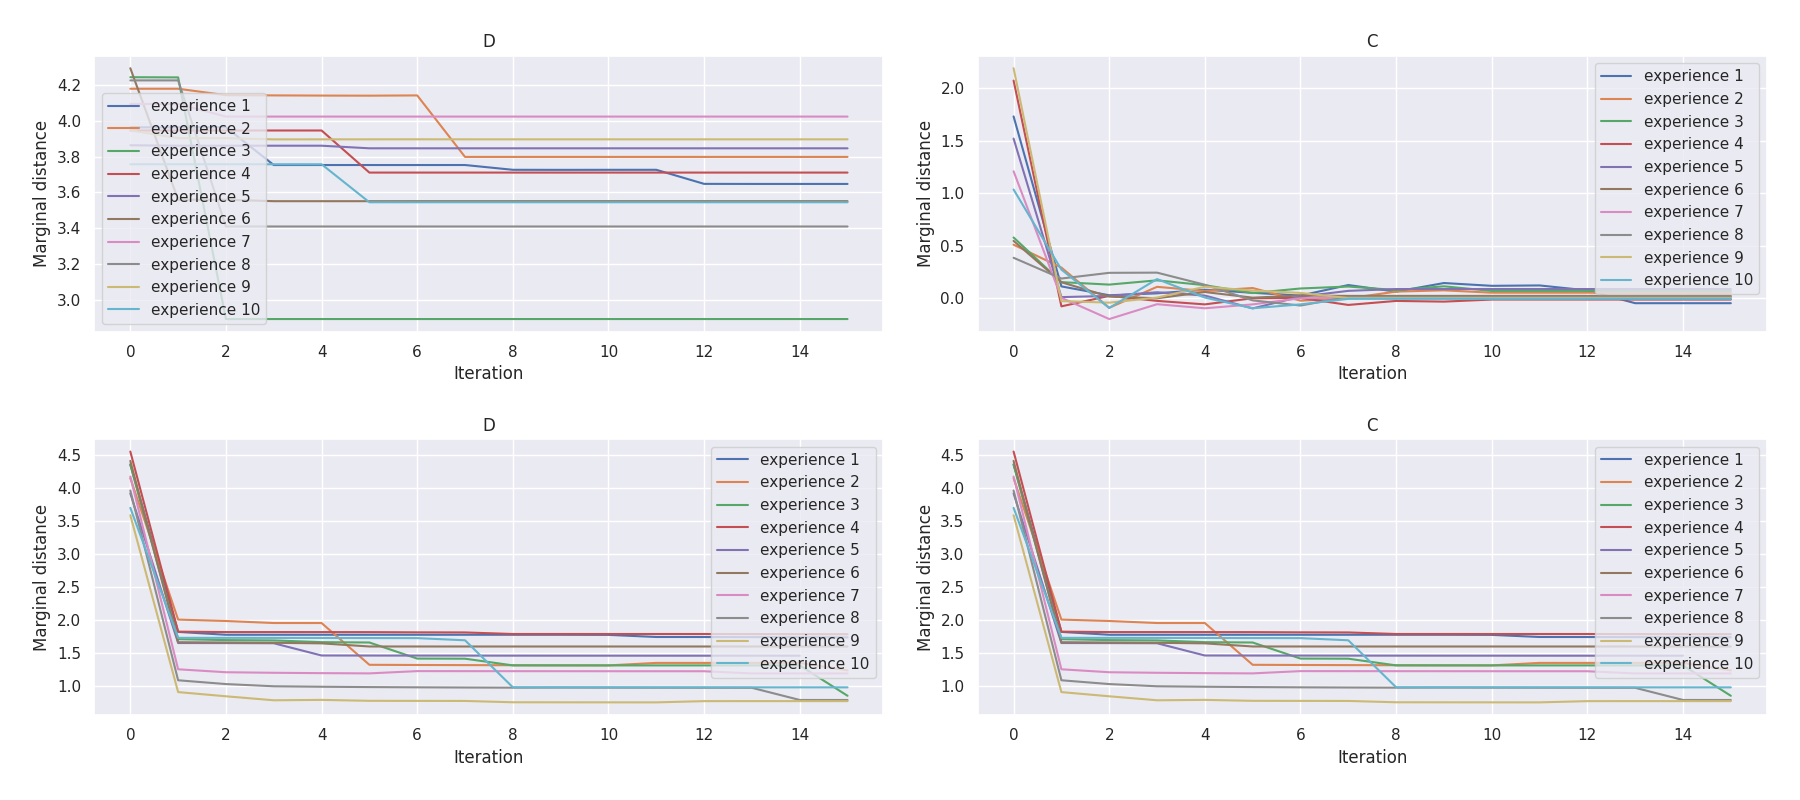
t-plots: DTF-MO (top), DTF-2SO (bottom) |
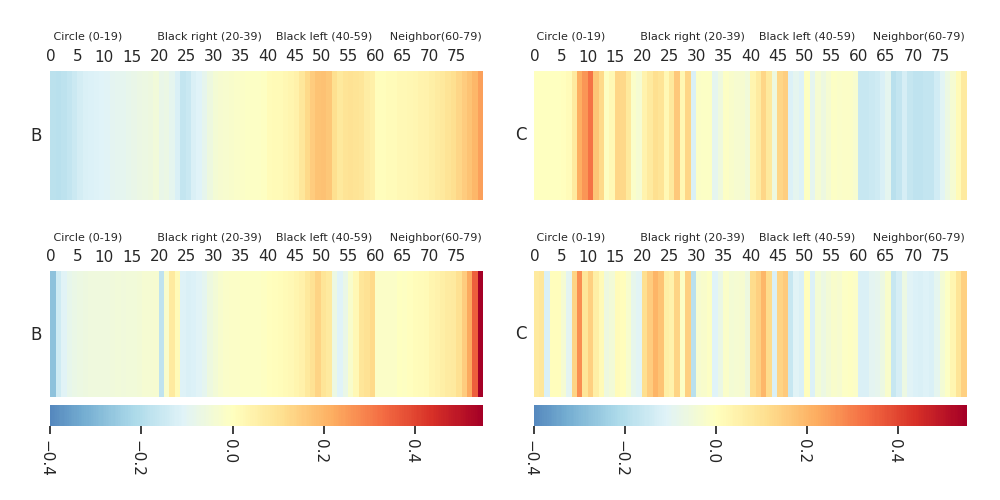
Heatmaps: DTF-MO (top), DTF-2SO (bottom) |
 |
 |
Videos to show that in SUB-MISSION D of mC·D, the robots not only head towards the left landmark. Sometimes, they also trigger their own cue to signal other robots to follow them—a communication behavior previously observed in AutoMoDe-TuttiFrutti. |
With DTF-2SO, some robots do not see the black left area. |
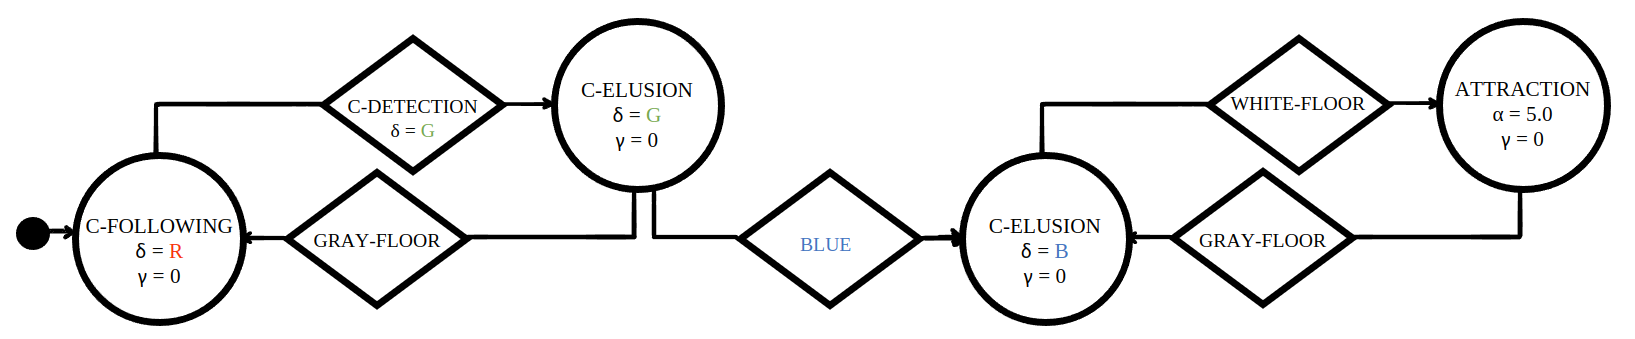
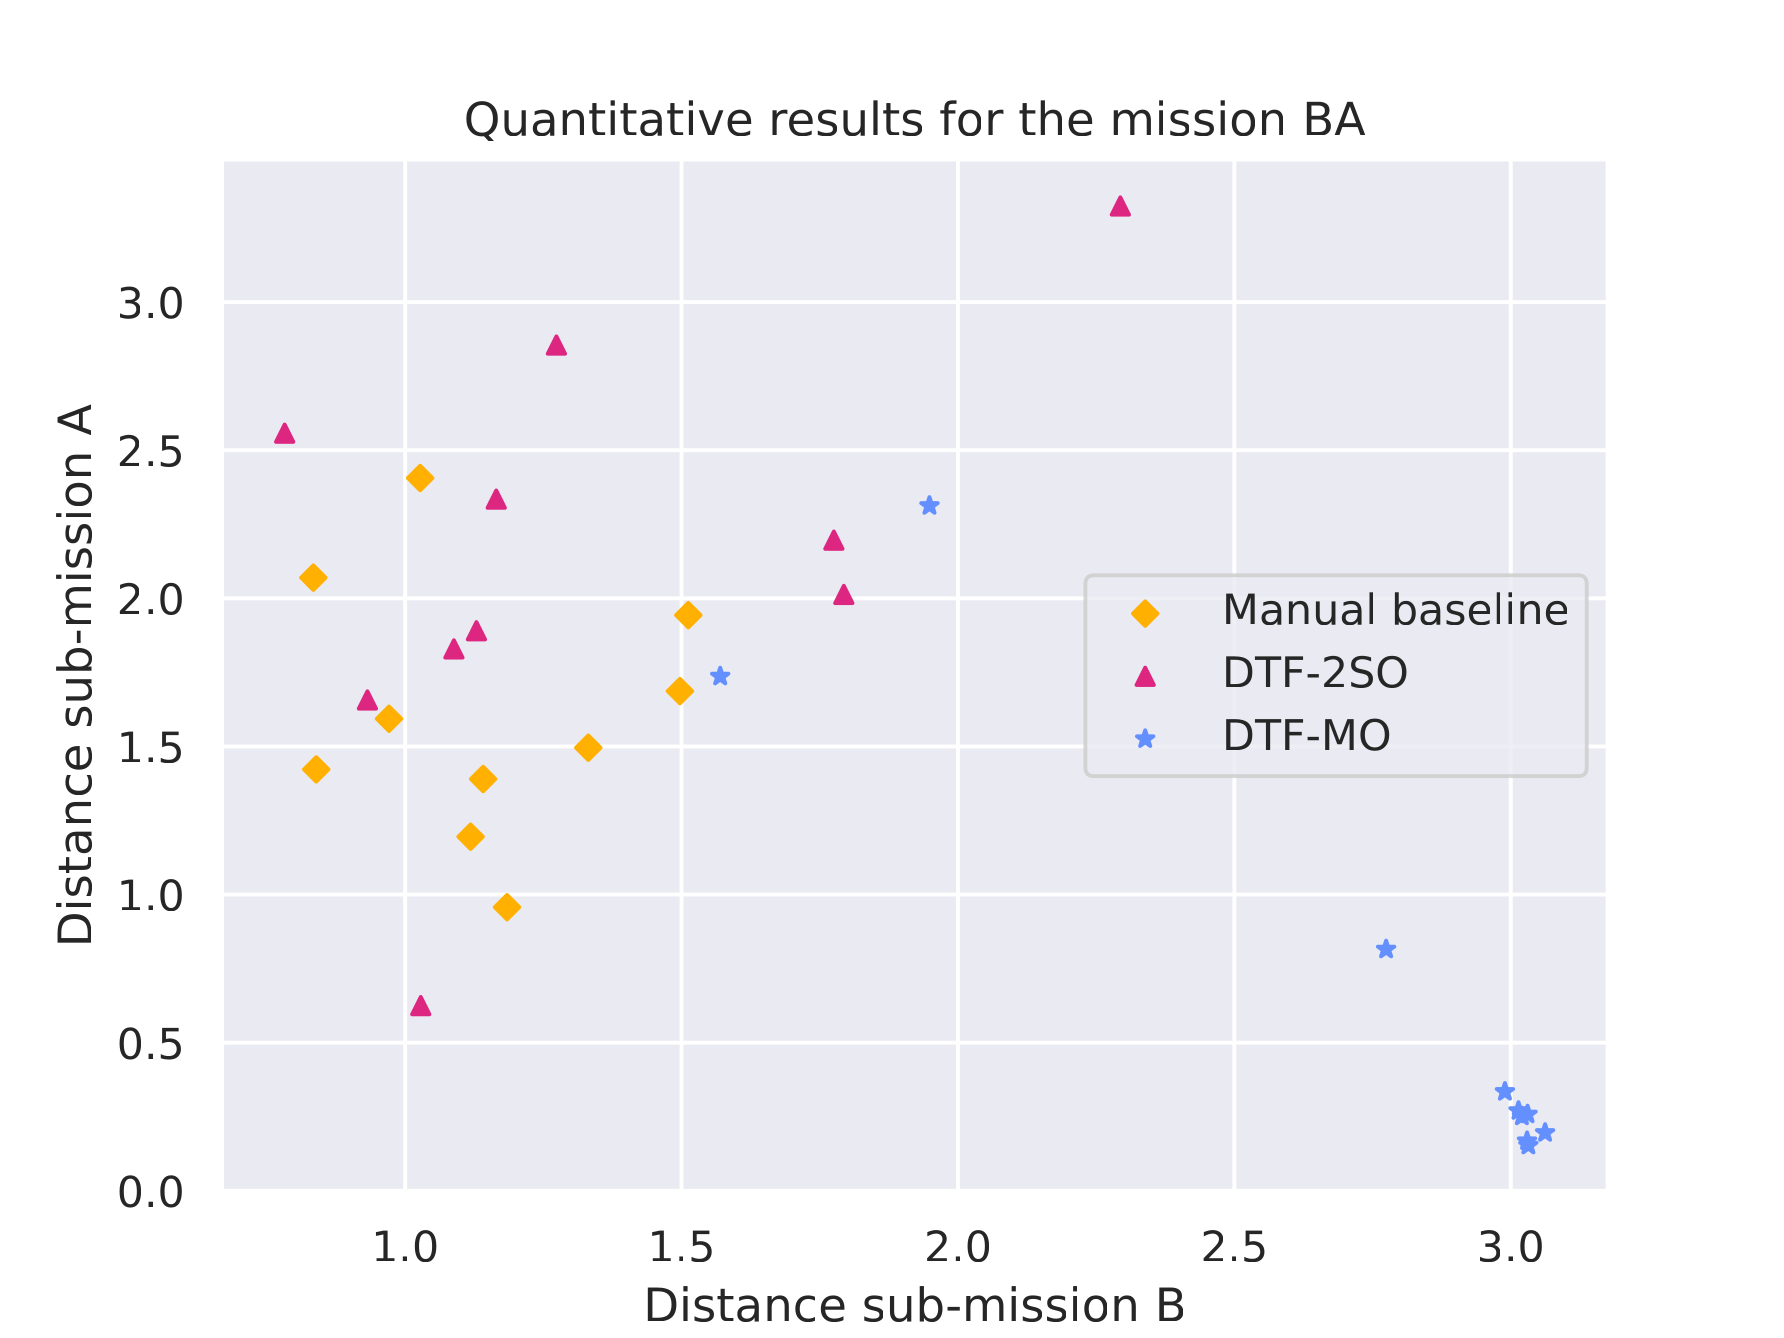
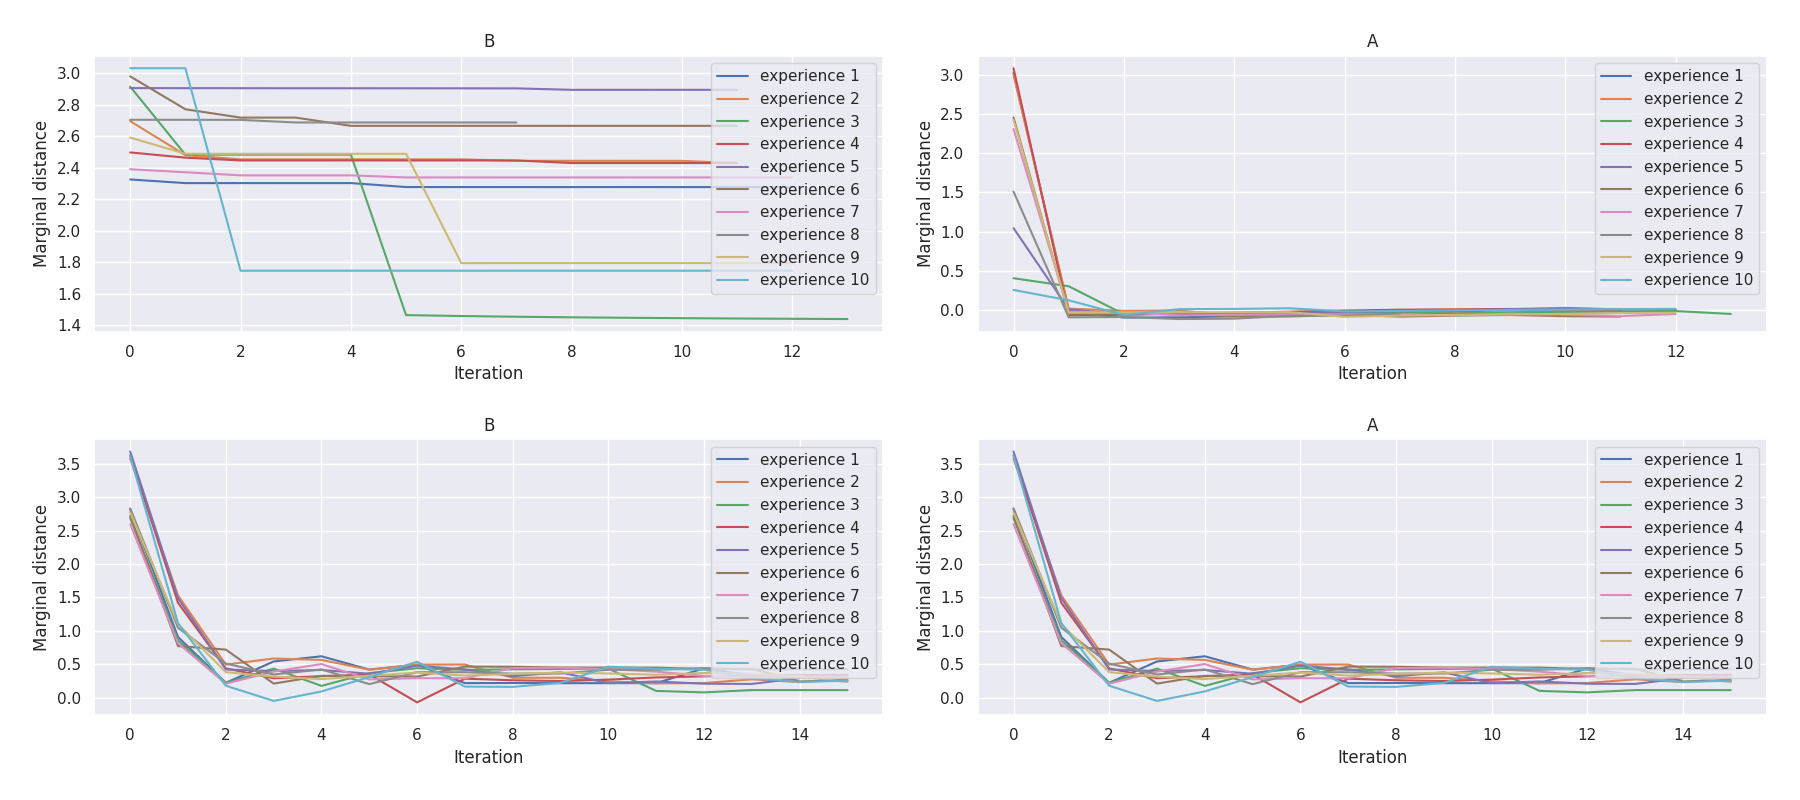
Mission B·A |
|
Baseline control software |
Quantitative results |
 |
 |
t-plots: DTF-MO (top), DTF-2SO (bottom) |
Heatmaps: DTF-MO (top), DTF-2SO (bottom) |
 |
 |
Mission E·A |
|
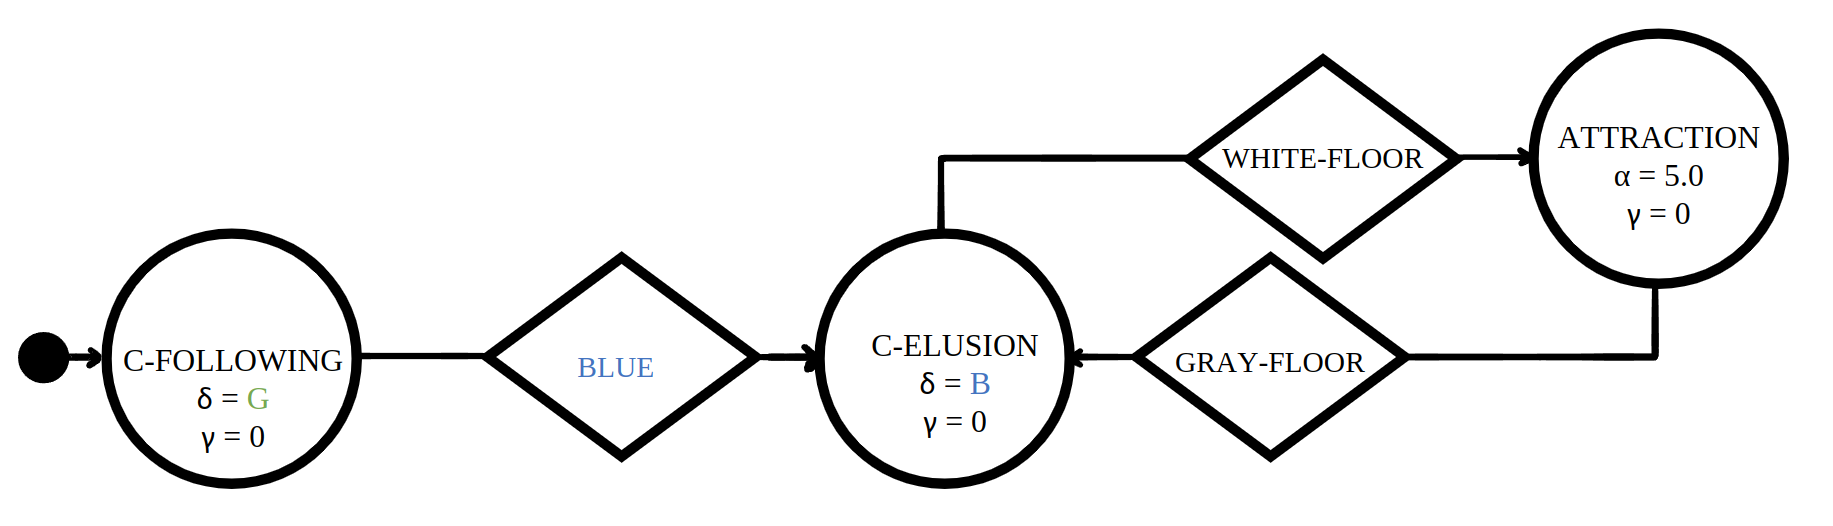
Baseline control software |
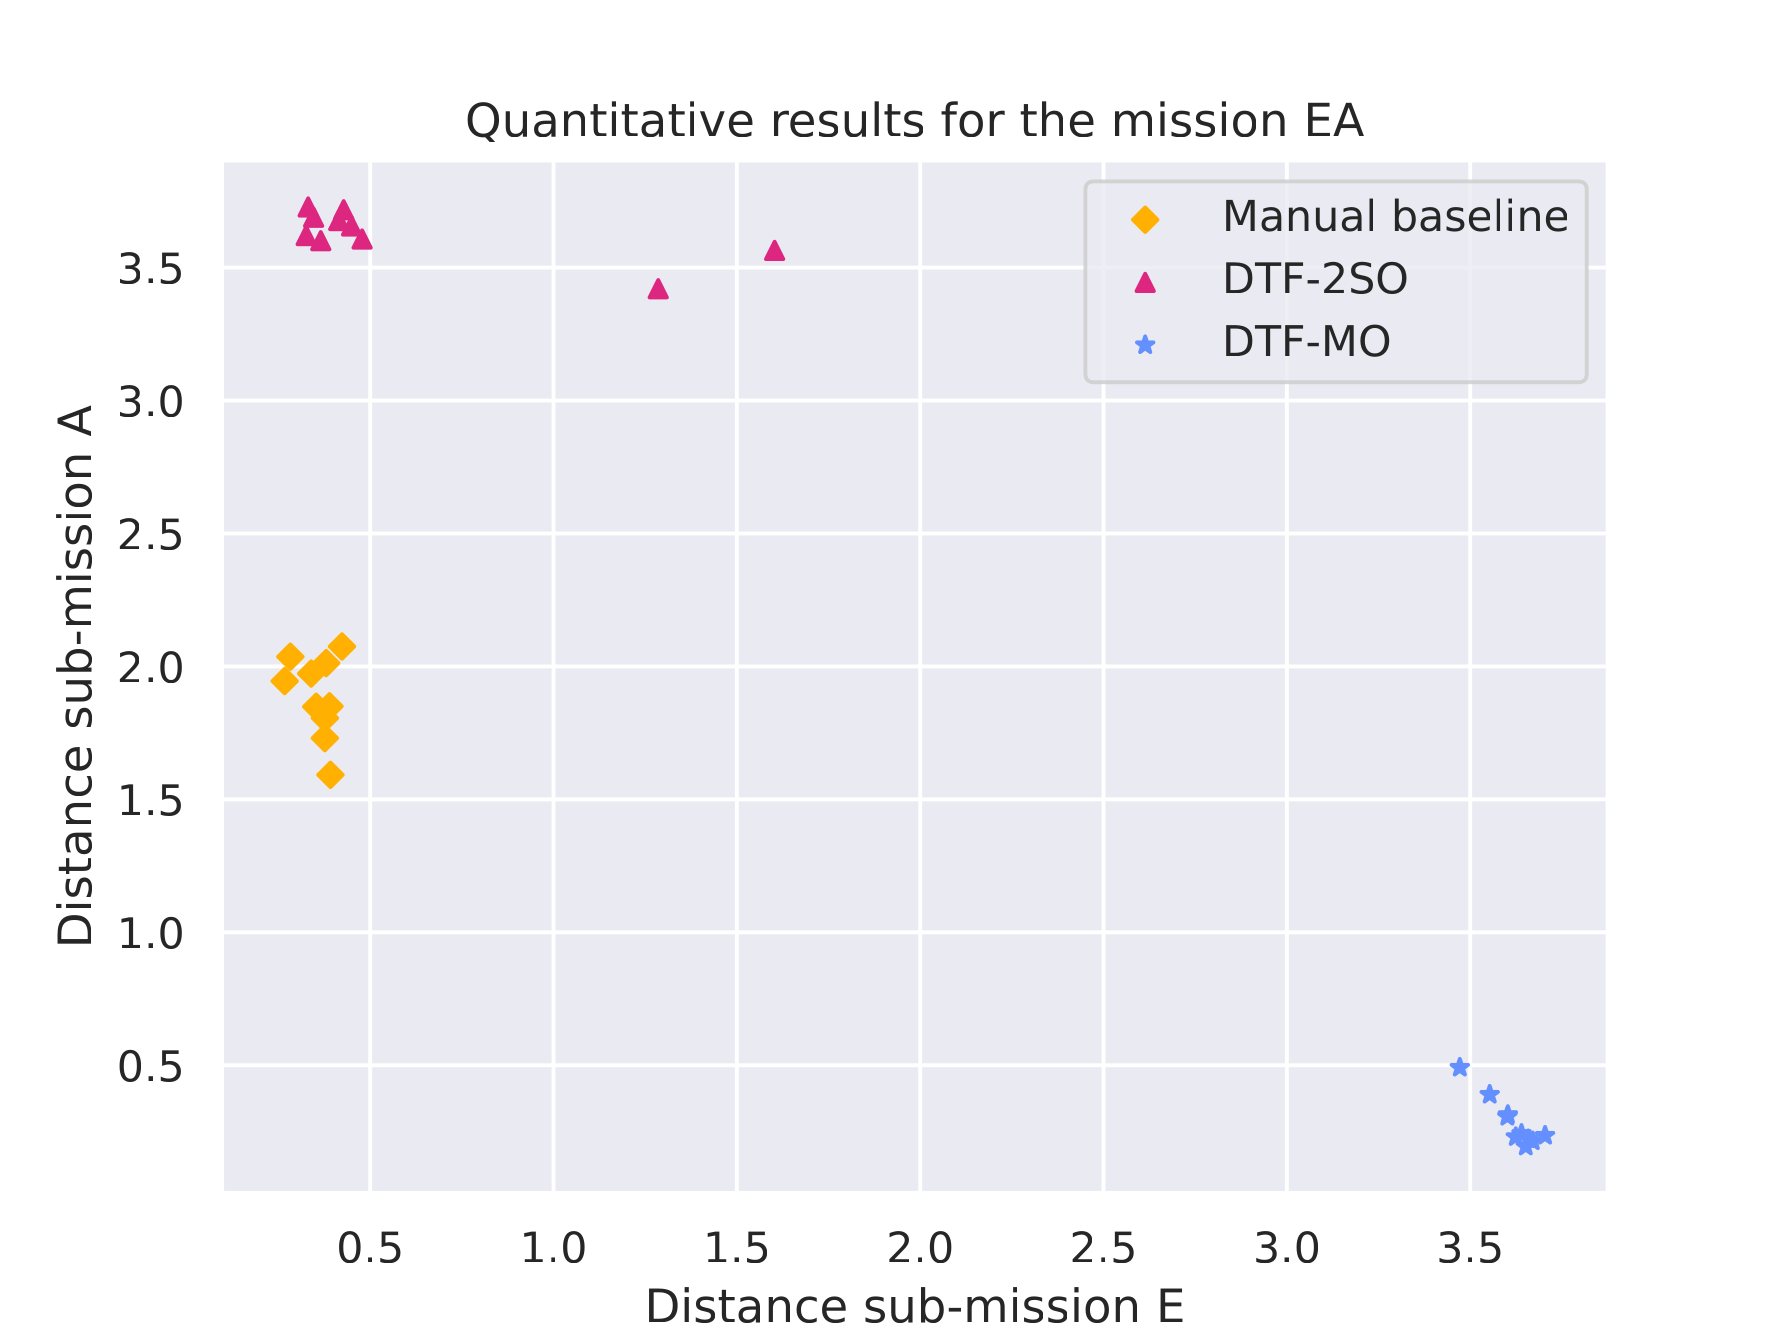
Quantitative results |
 |
 |
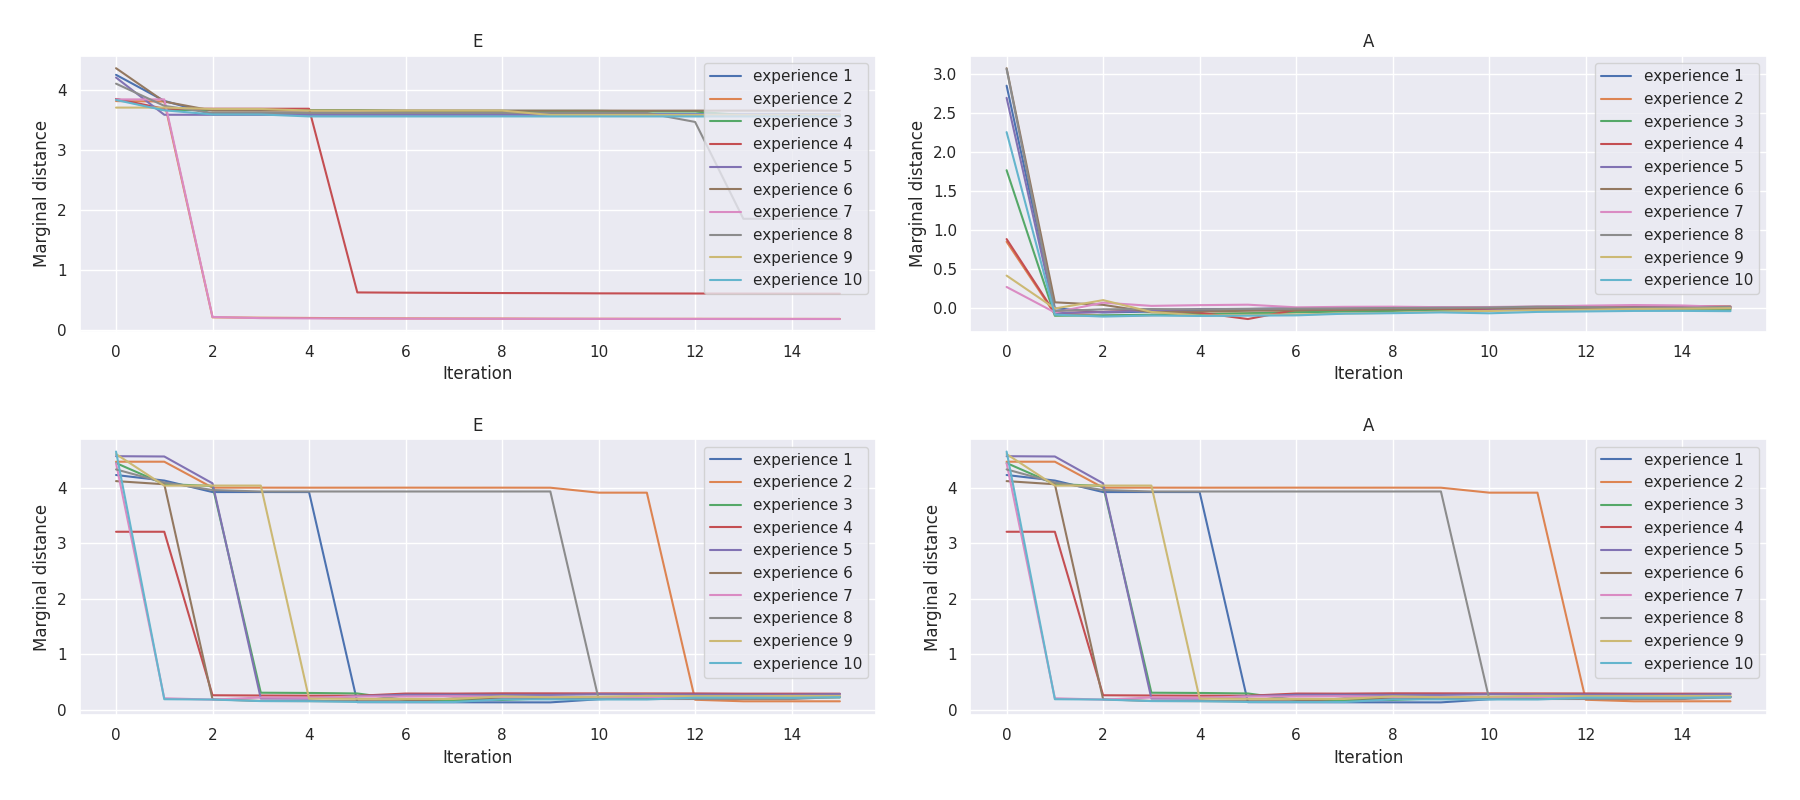
t-plots: DTF-MO (top), DTF-2SO (bottom) |
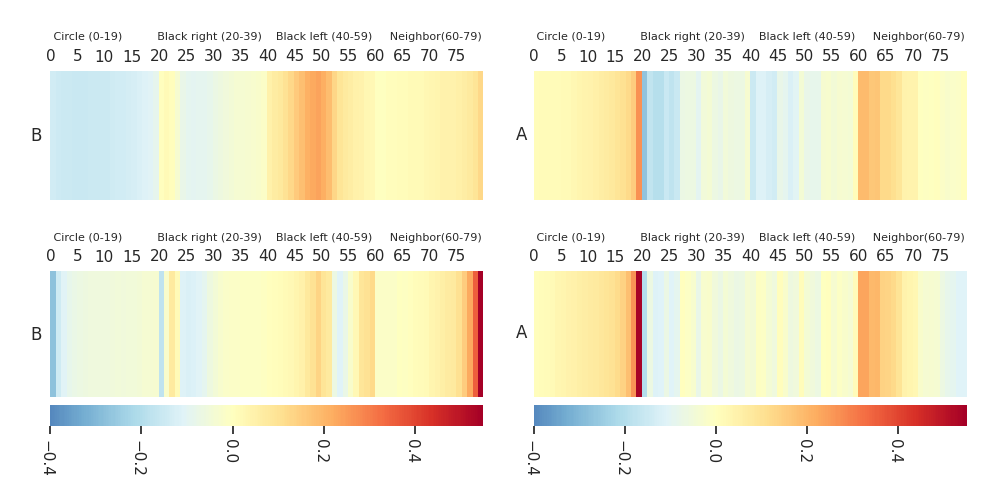
Heatmaps: DTF-MO (top), DTF-2SO (bottom) |
 |
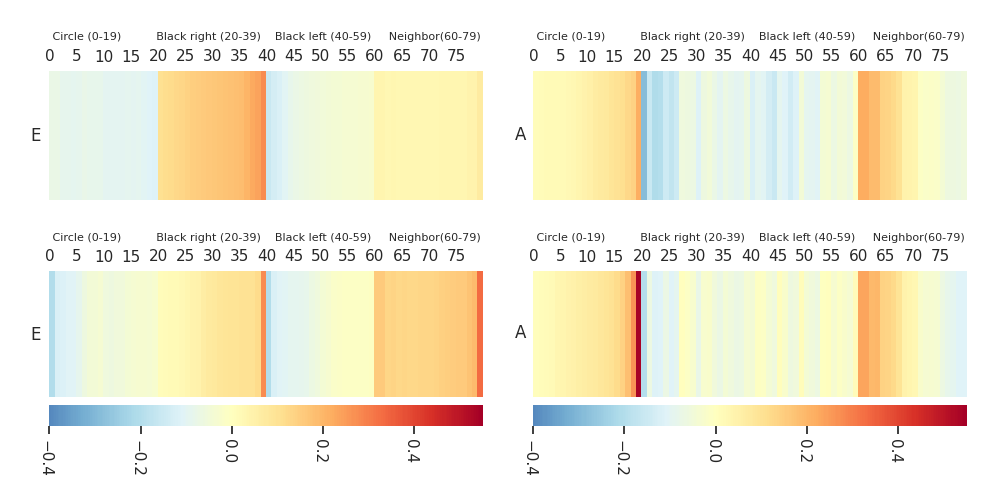 |
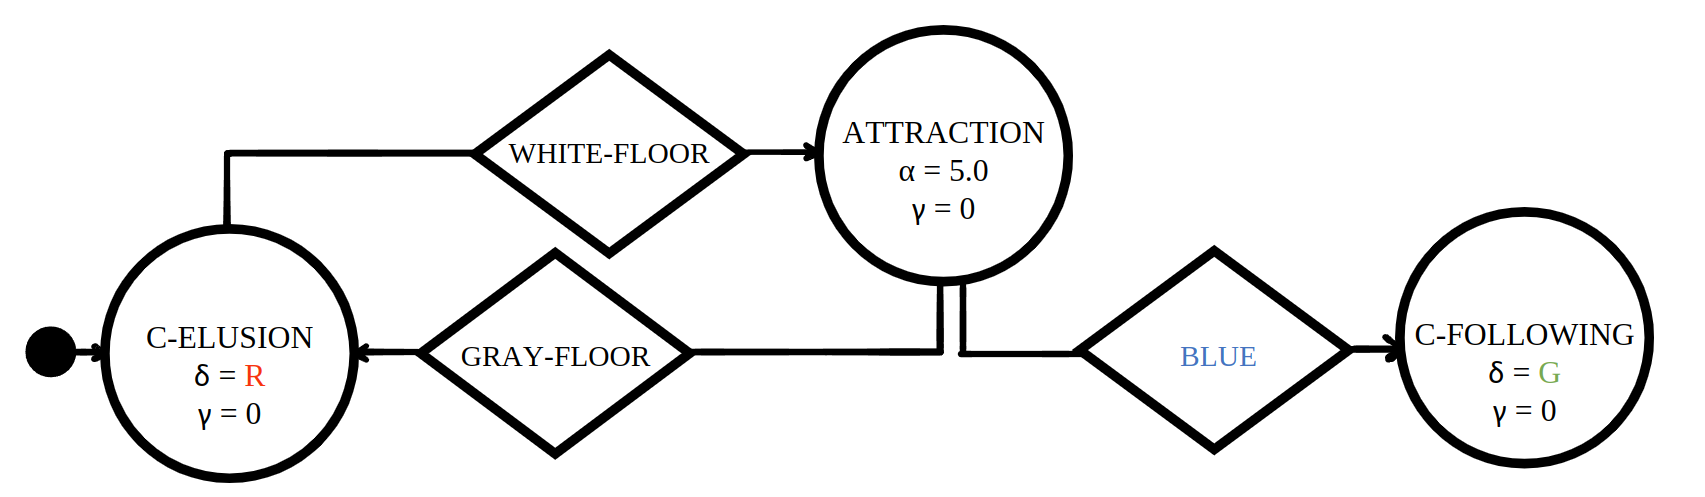
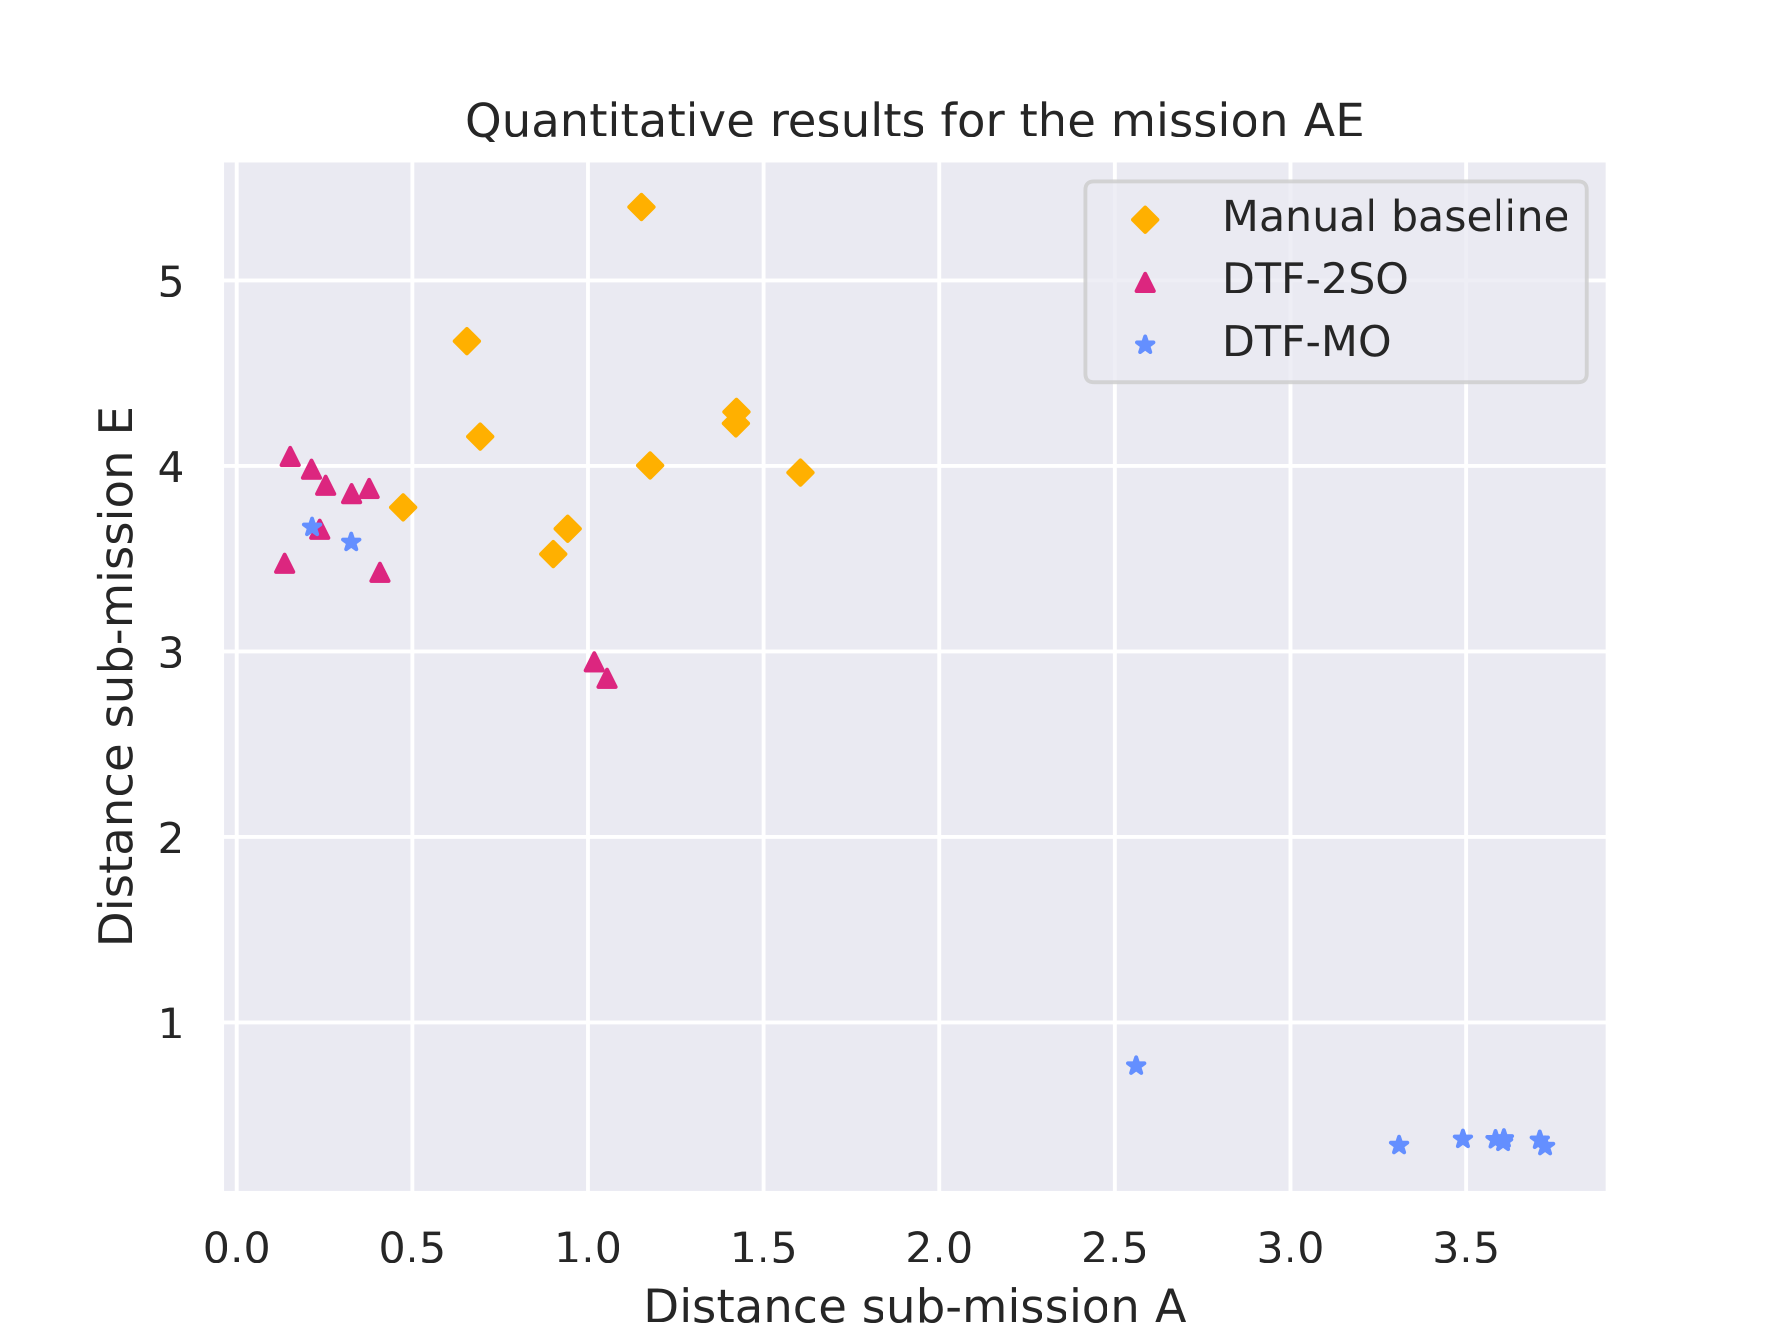
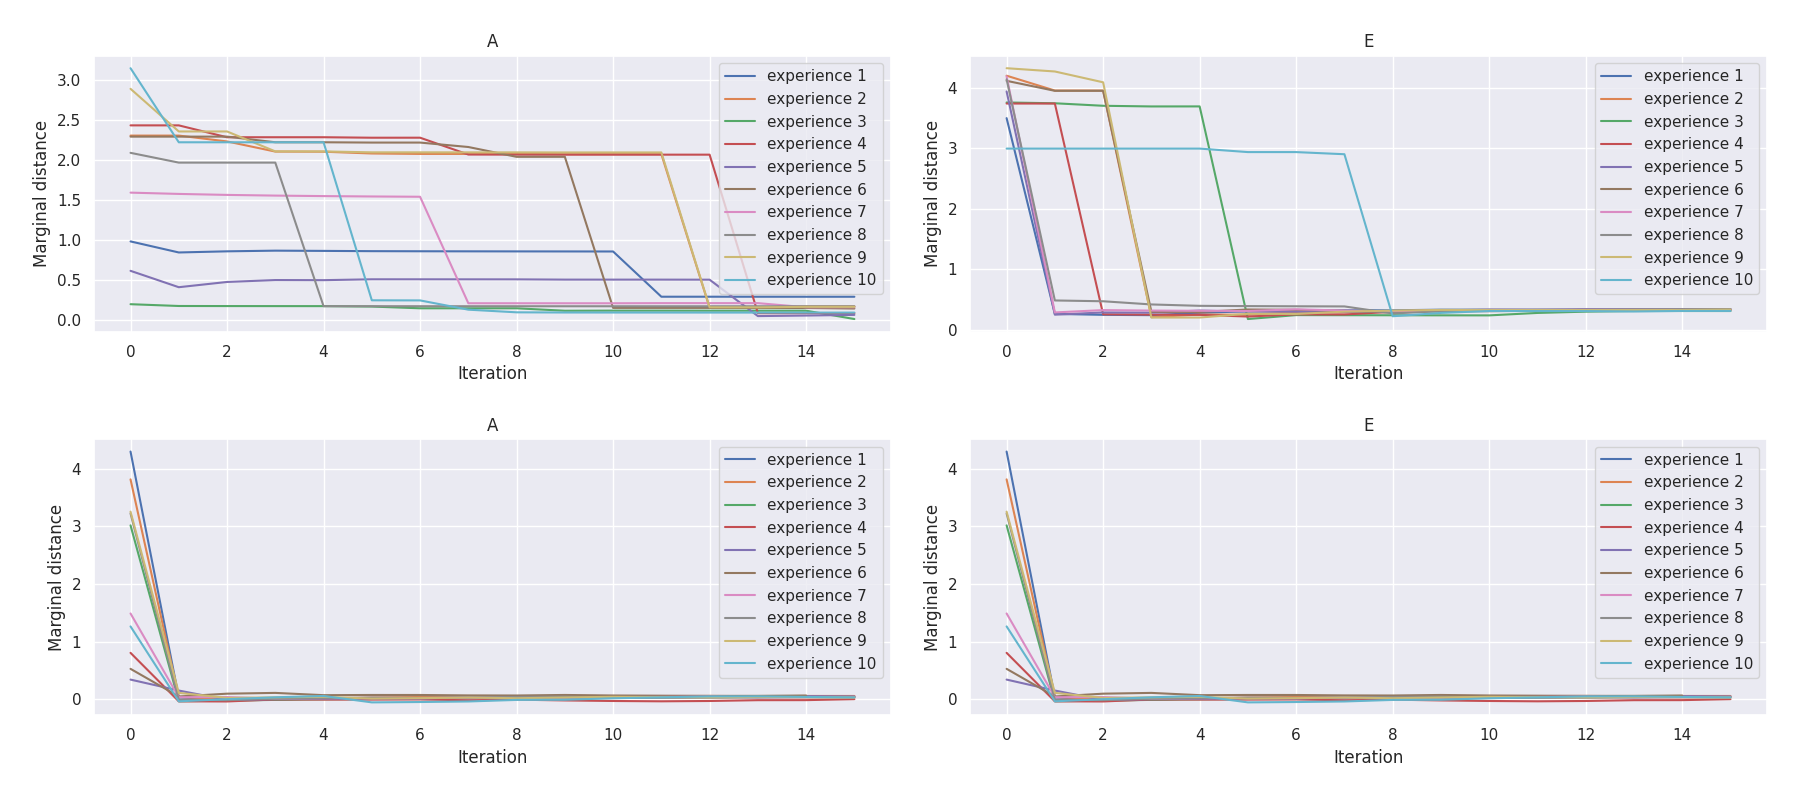
Mission A·E |
|
Baseline control software |
Quantitative results |
 |
 |
t-plots: DTF-MO (top), DTF-2SO (bottom) |
Heatmaps: DTF-MO (top), DTF-2SO (bottom) |
 |
 |
Mission D·C |
|
Baseline control software |
Quantitative results |
 |
 |
t-plots: DTF-MO (top), DTF-2SO (bottom) |
Heatmaps: DTF-MO (top), DTF-2SO (bottom) |
 |
 |
Mission B·E |
|
Baseline control software |
Quantitative results |
 |
 |
t-plots: DTF-MO (top), DTF-2SO (bottom) |
Heatmaps: DTF-MO (top), DTF-2SO (bottom) |
 |
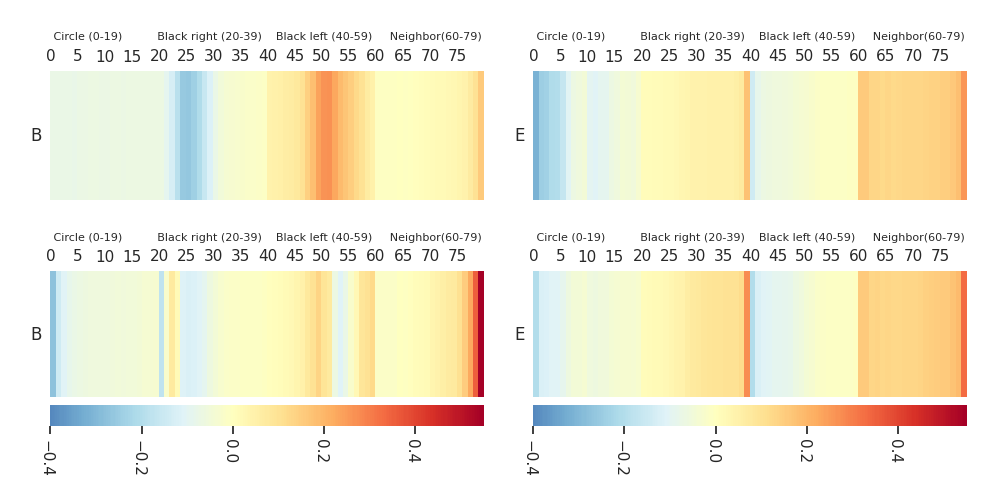 |
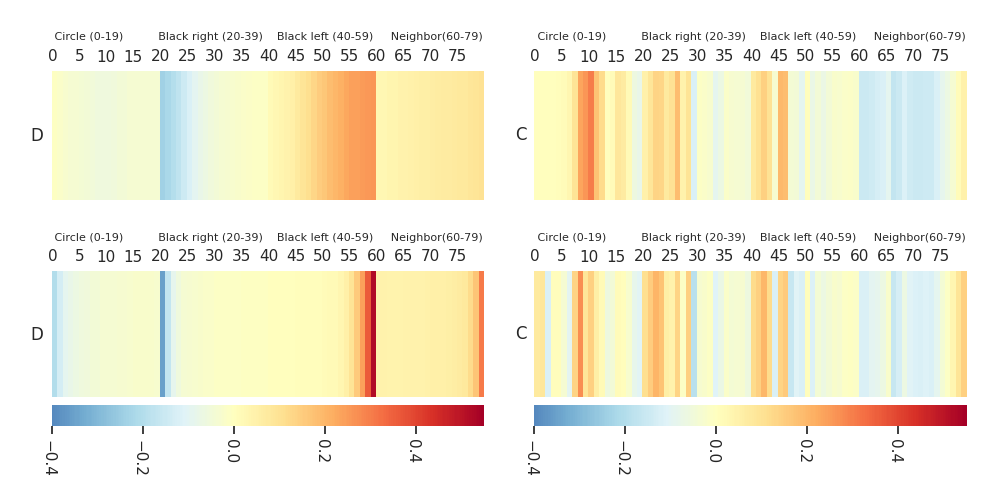
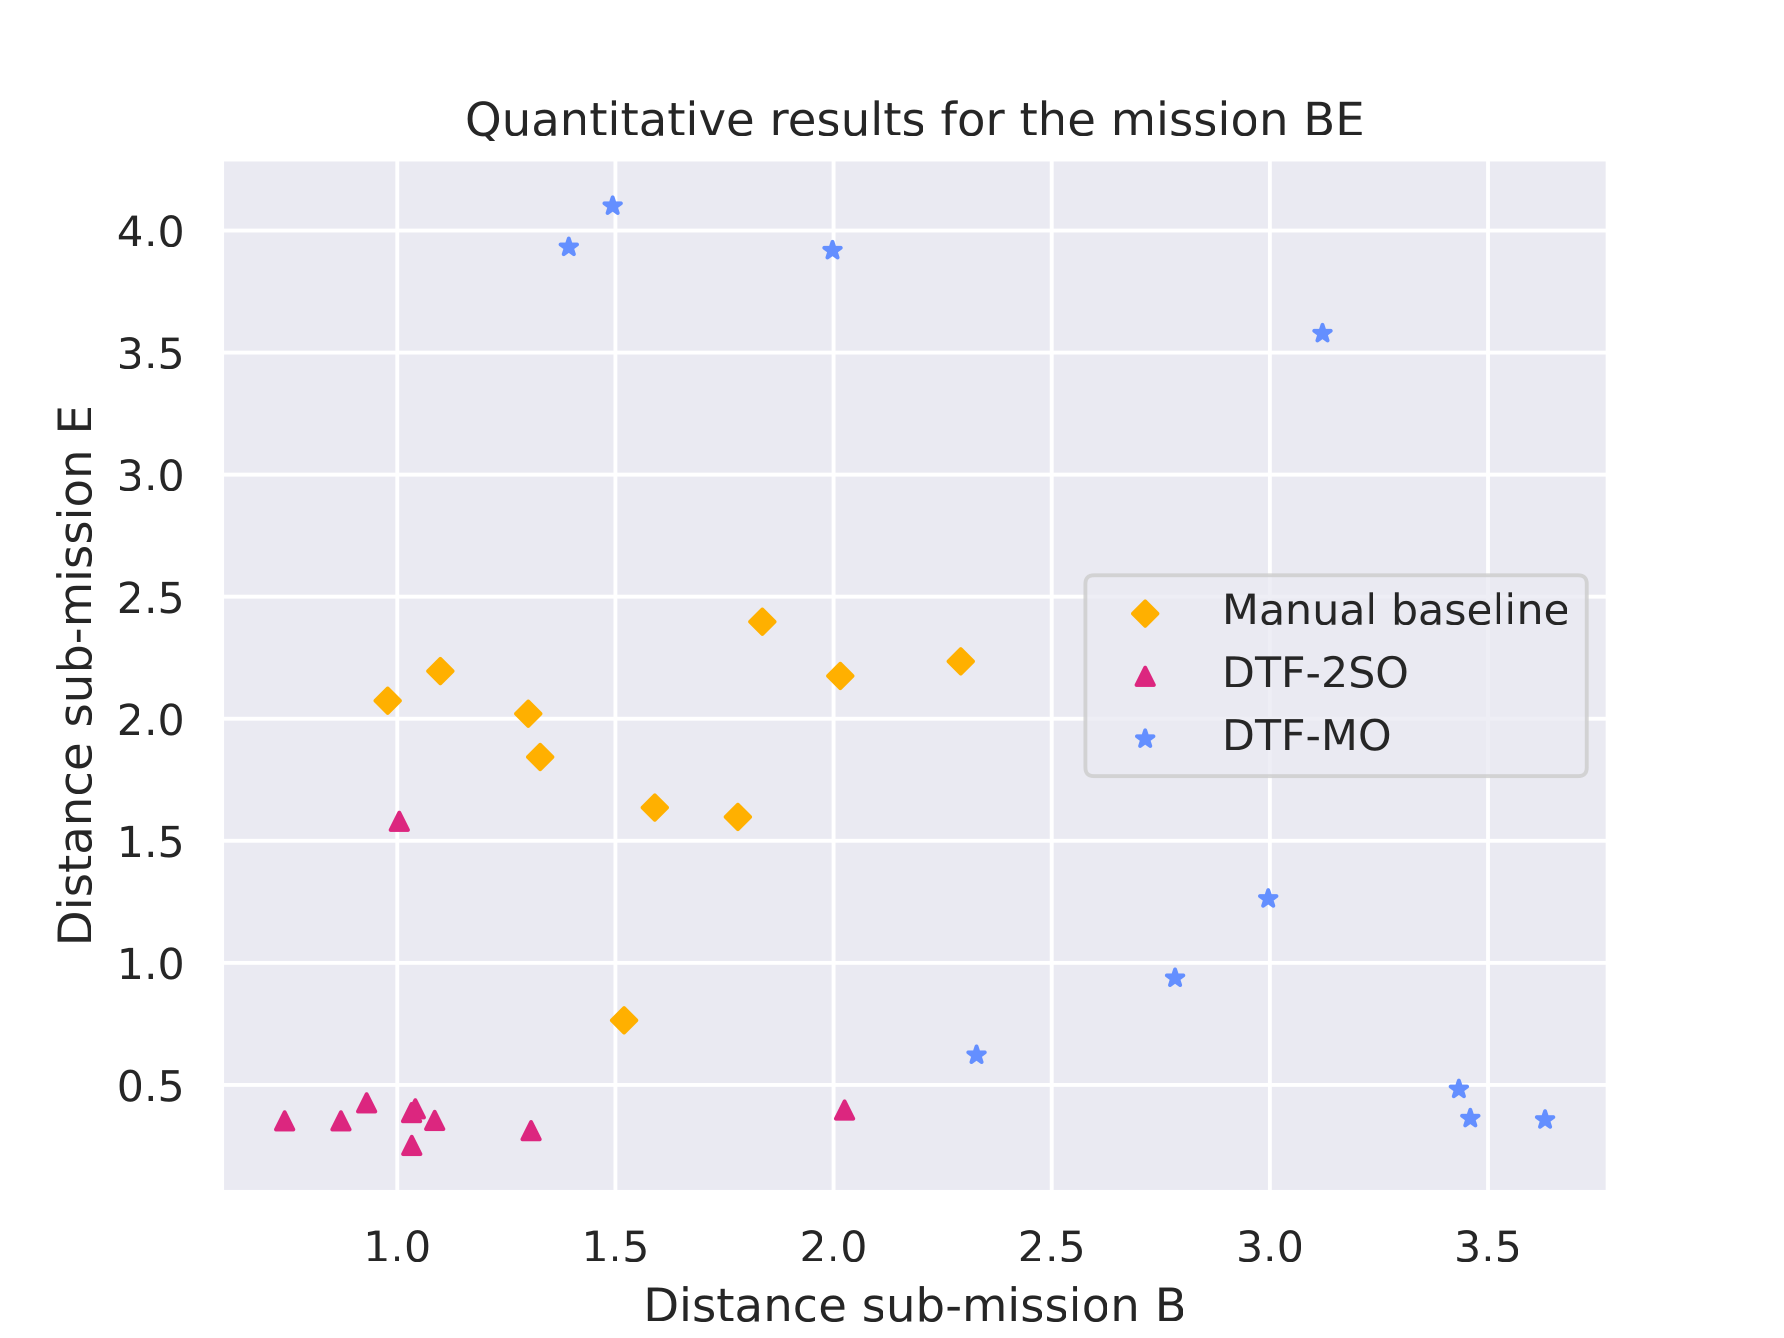
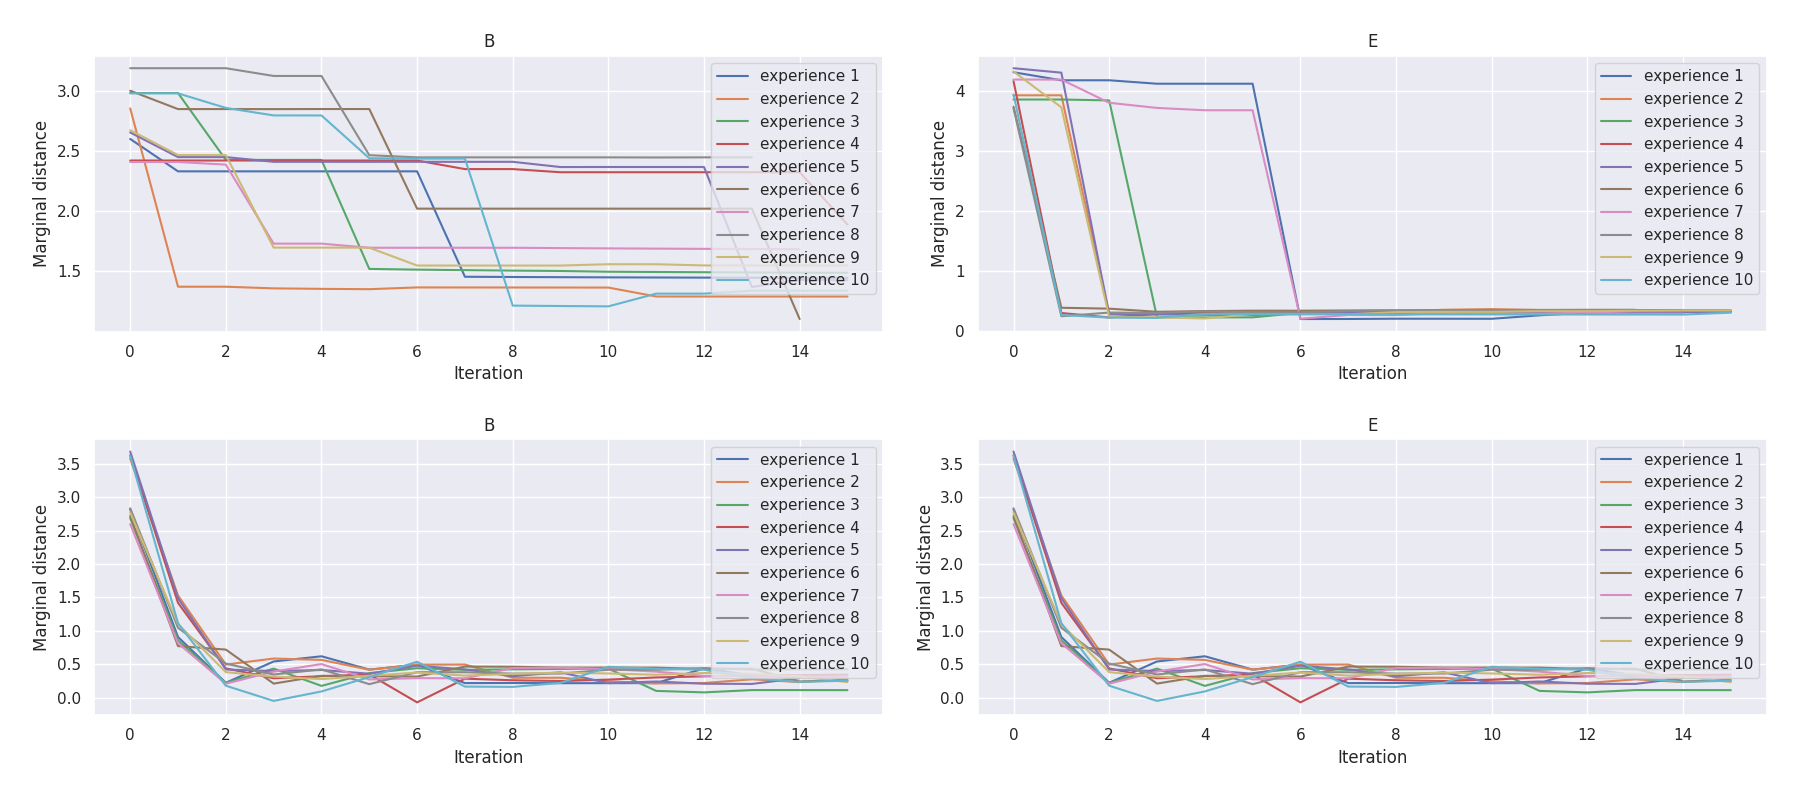
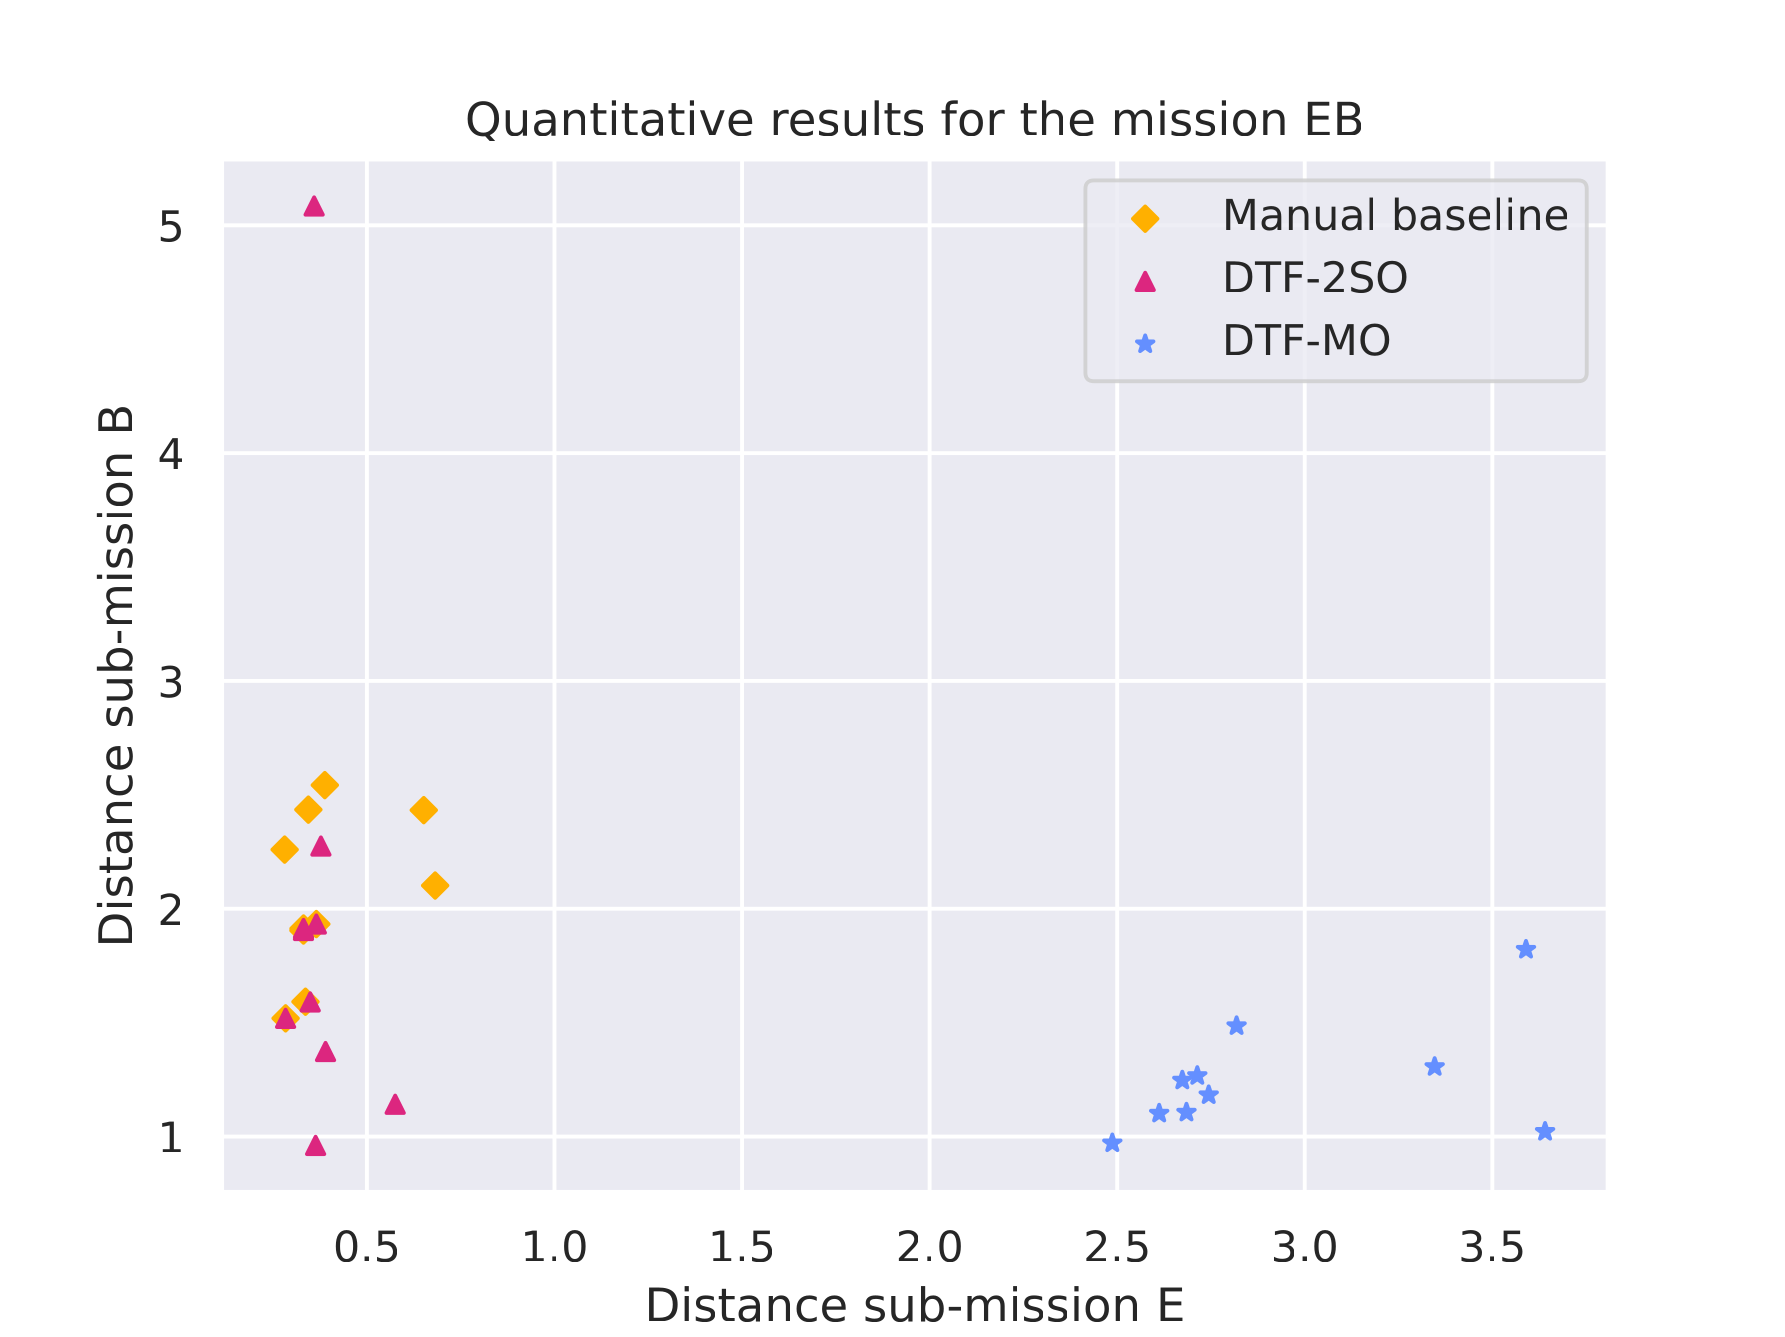
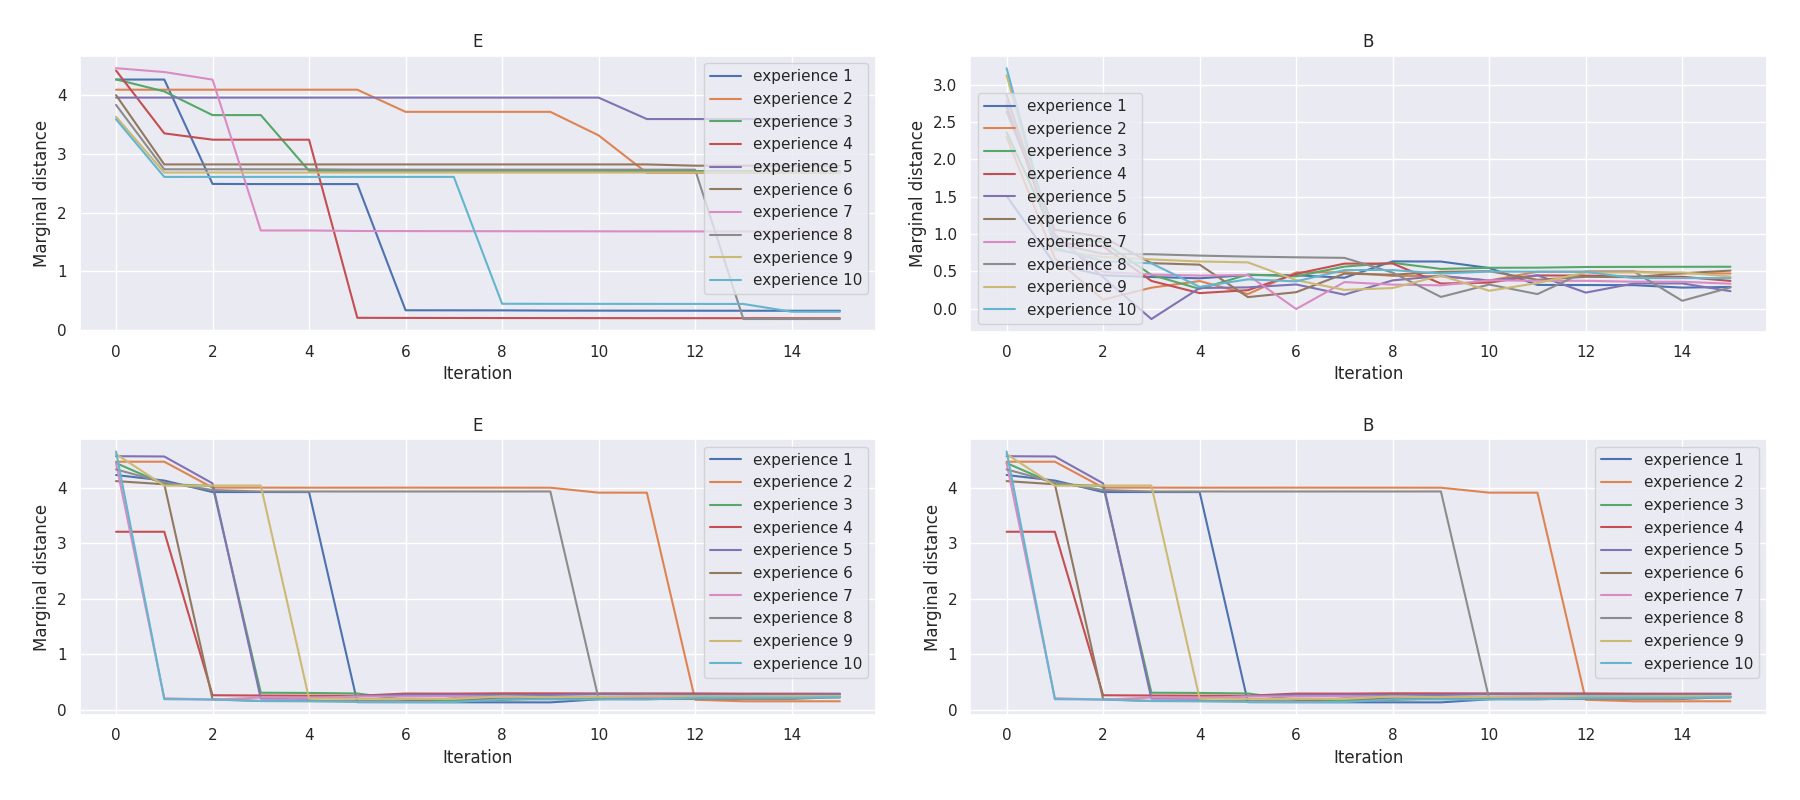
Mission E·B |
|
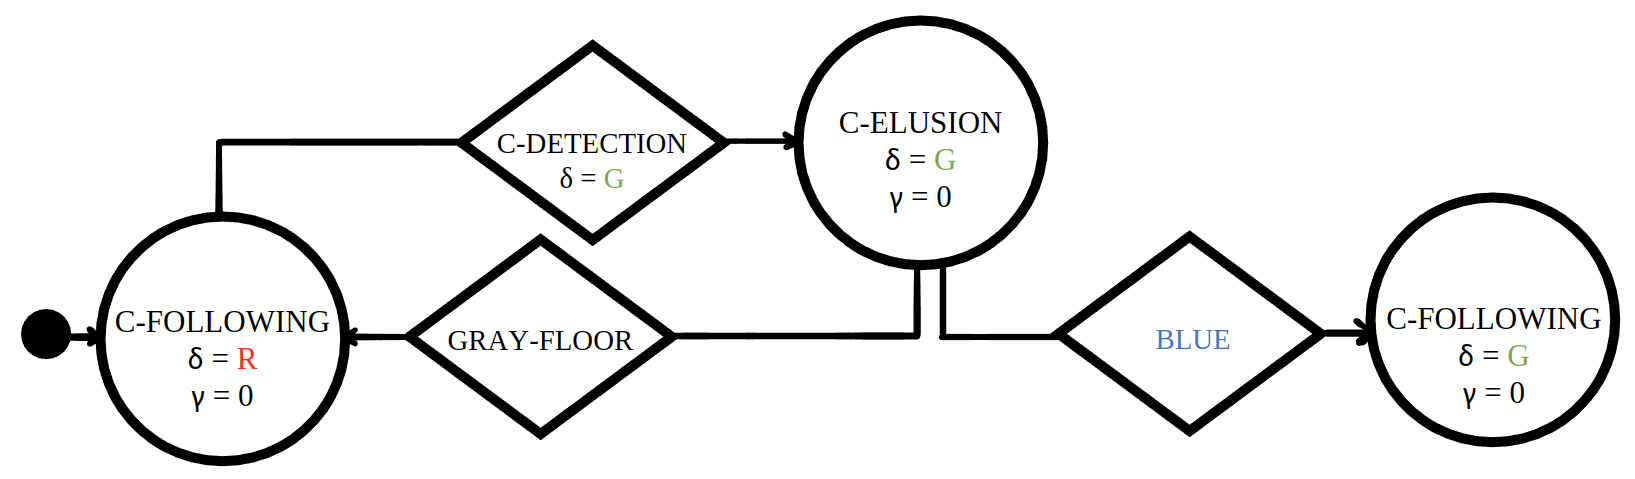
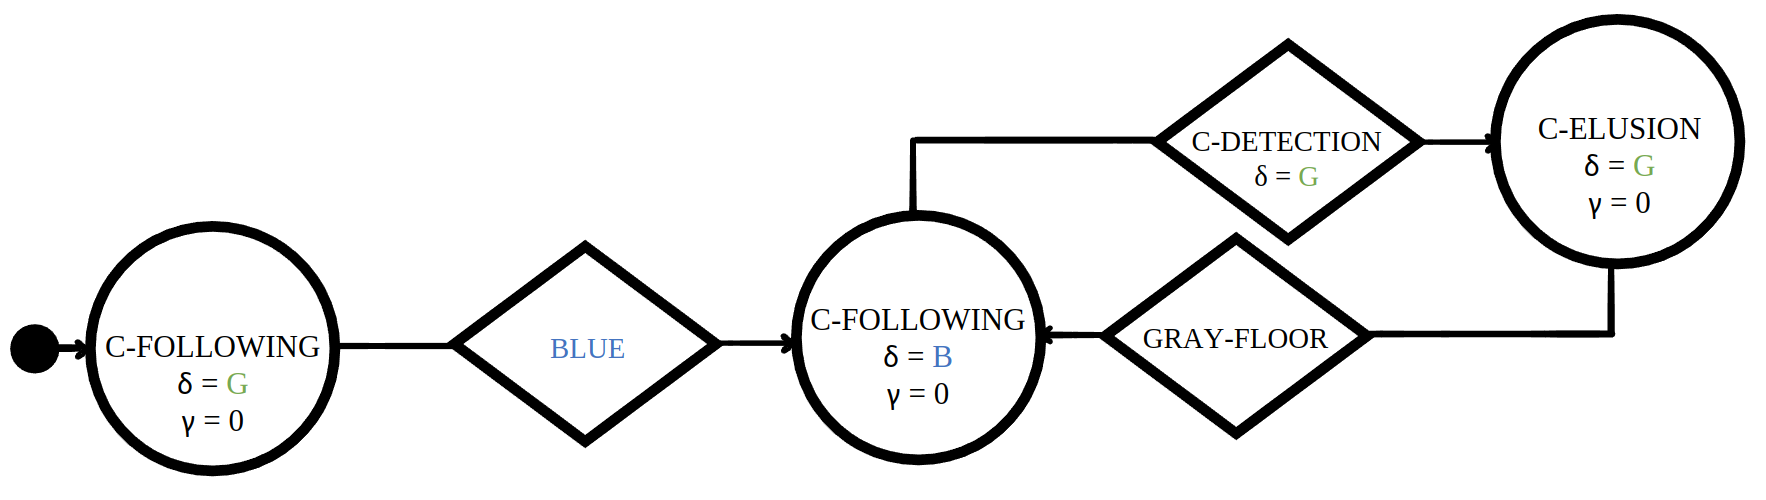
Baseline control software |
Quantitative results |
 |
 |
t-plots: DTF-MO (top), DTF-2SO (bottom) |
Heatmaps: DTF-MO (top), DTF-2SO (bottom) |
 |
 |
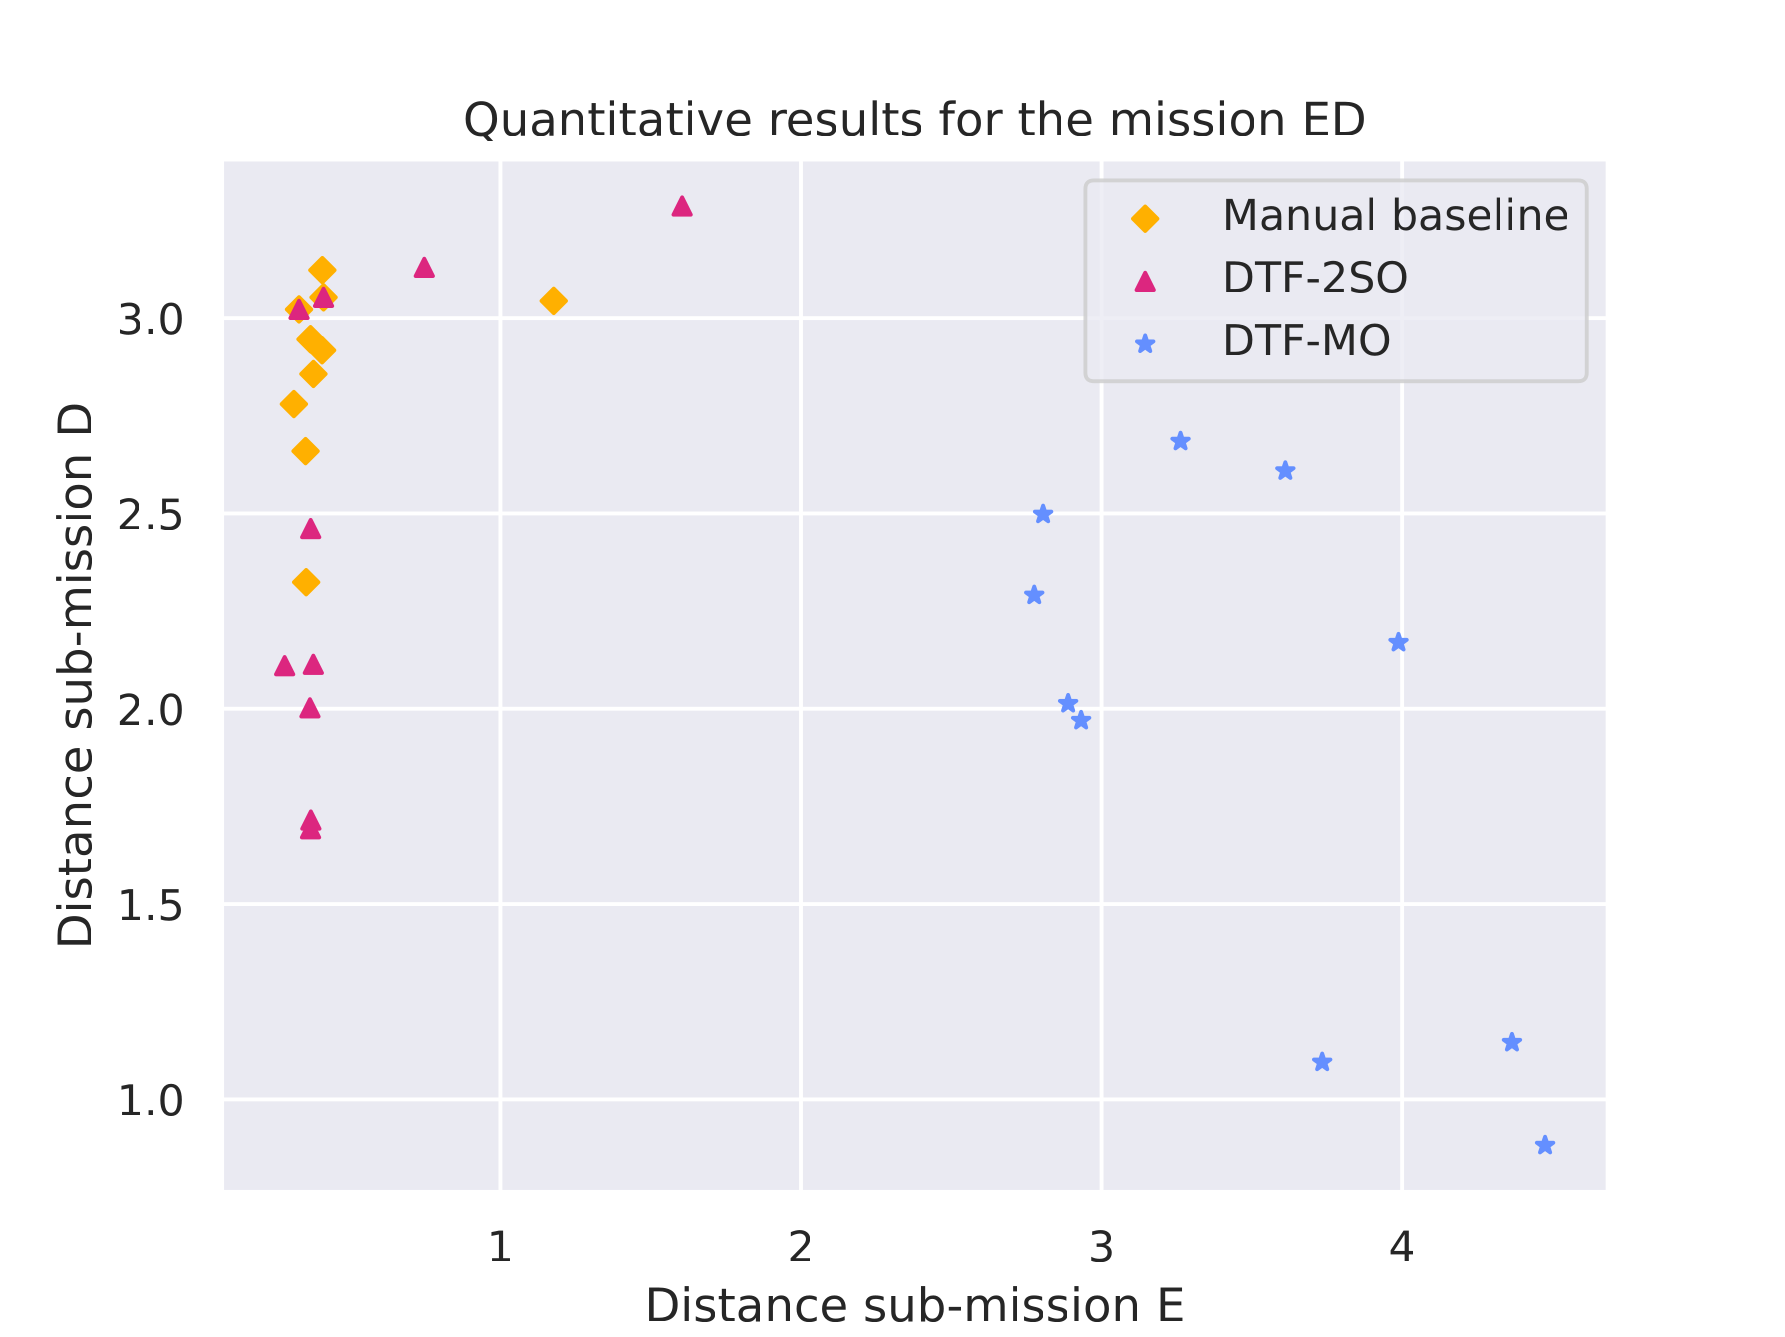
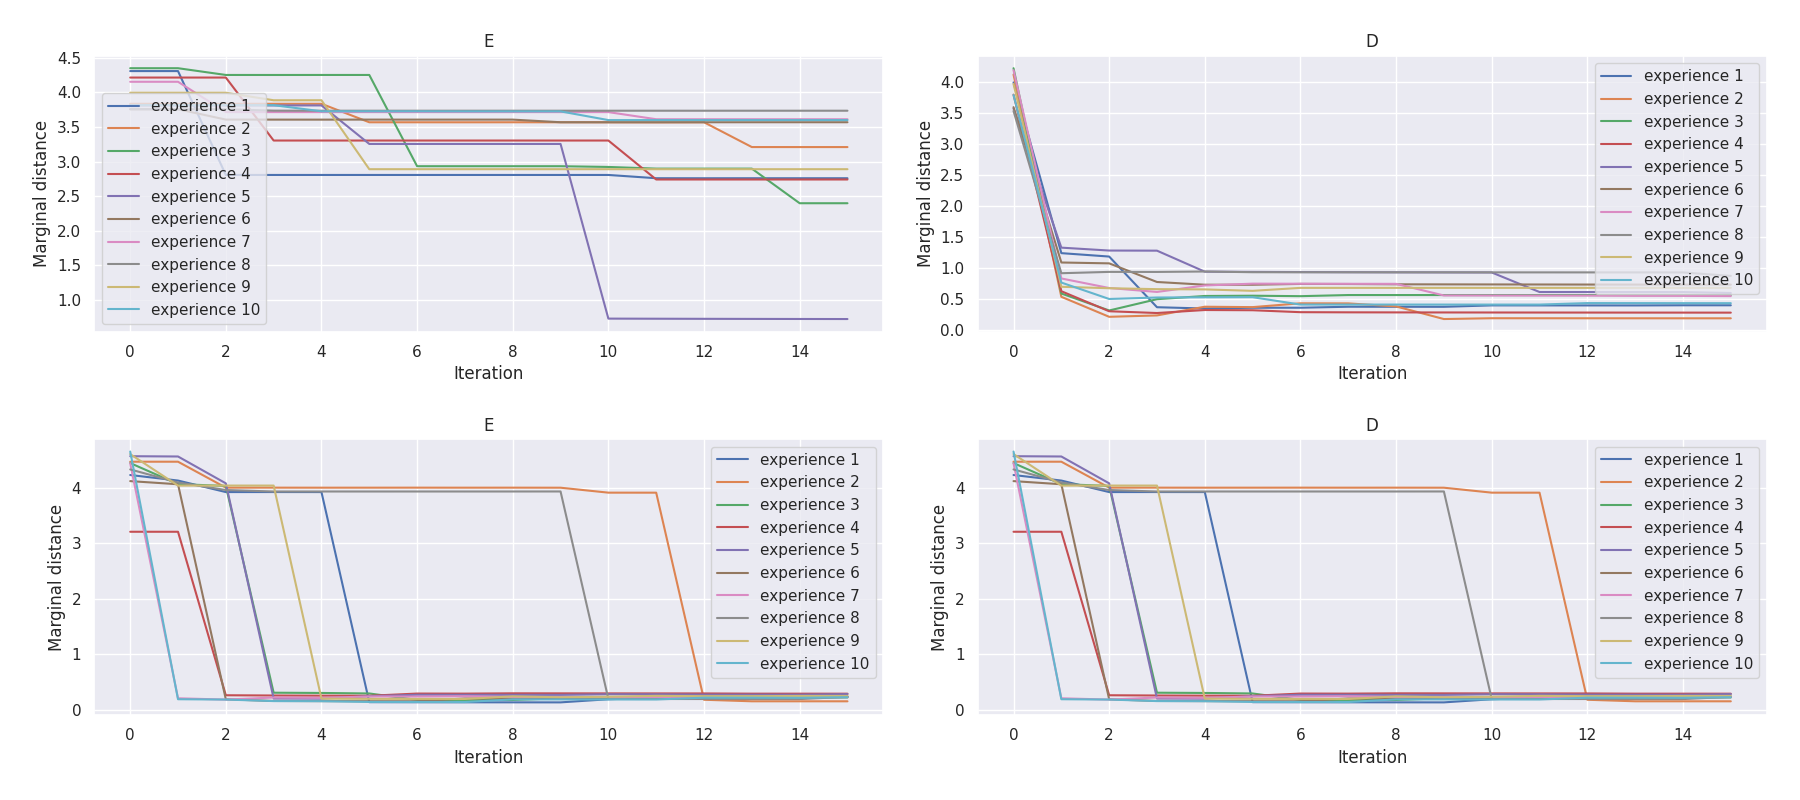
Mission E·D |
|
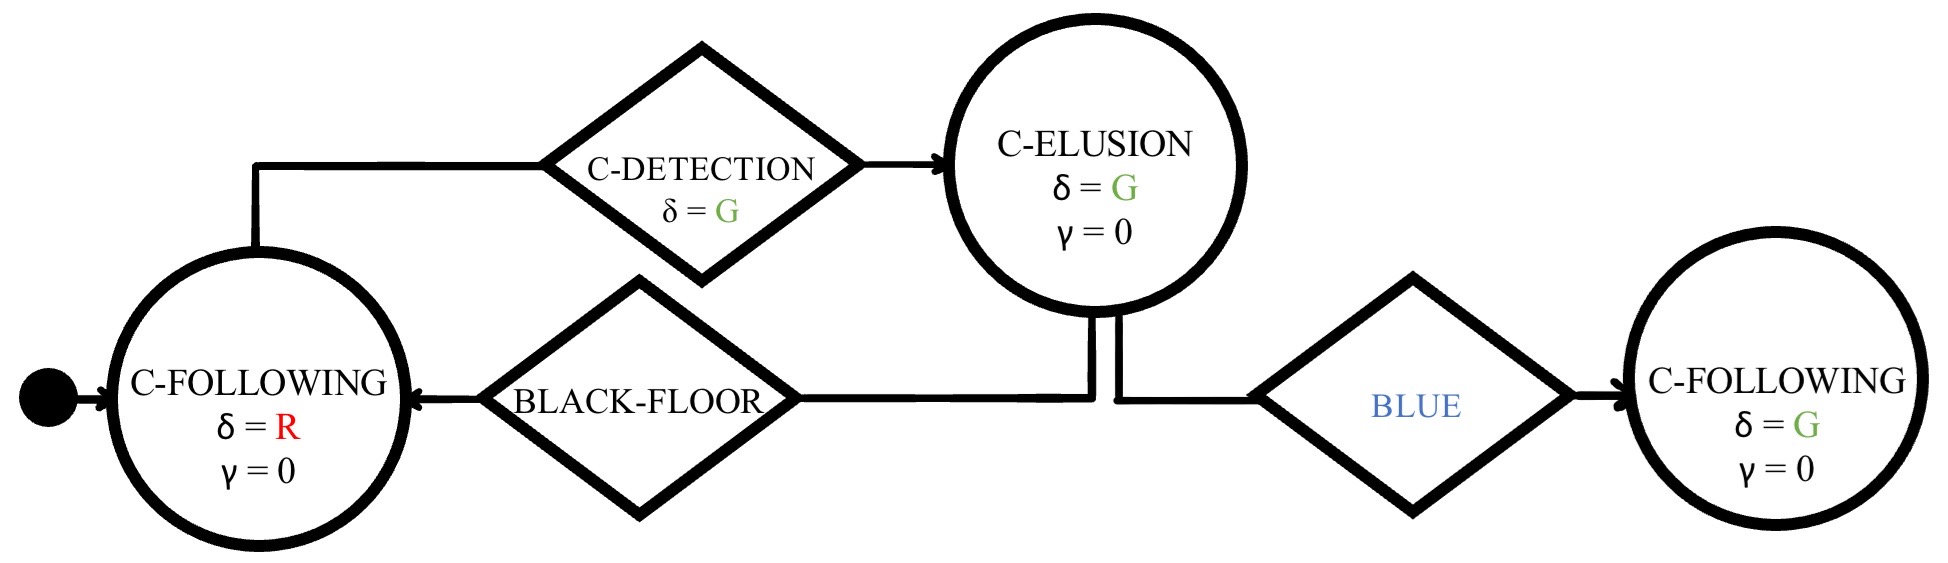
Baseline control software |
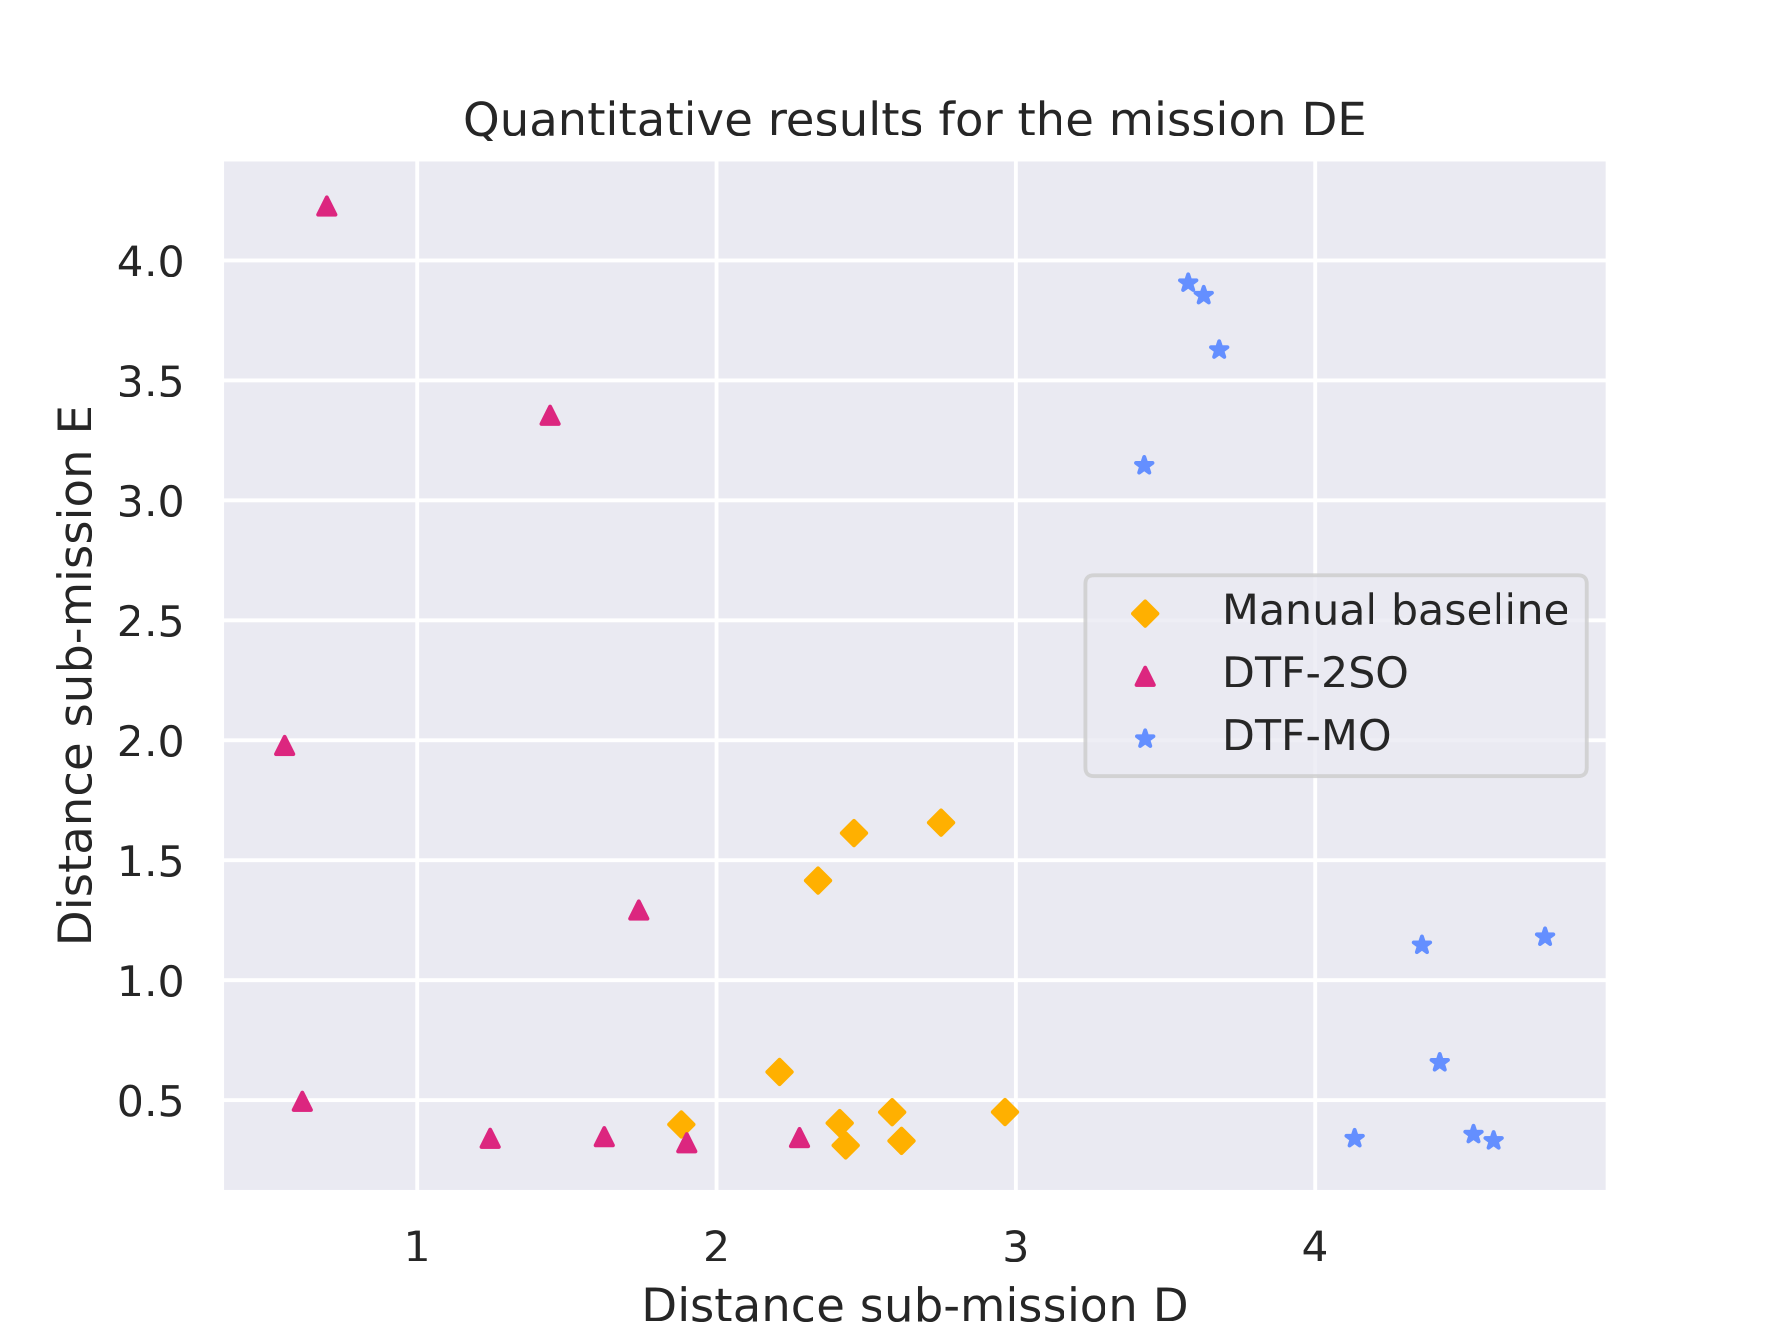
Quantitative results |
 |
 |
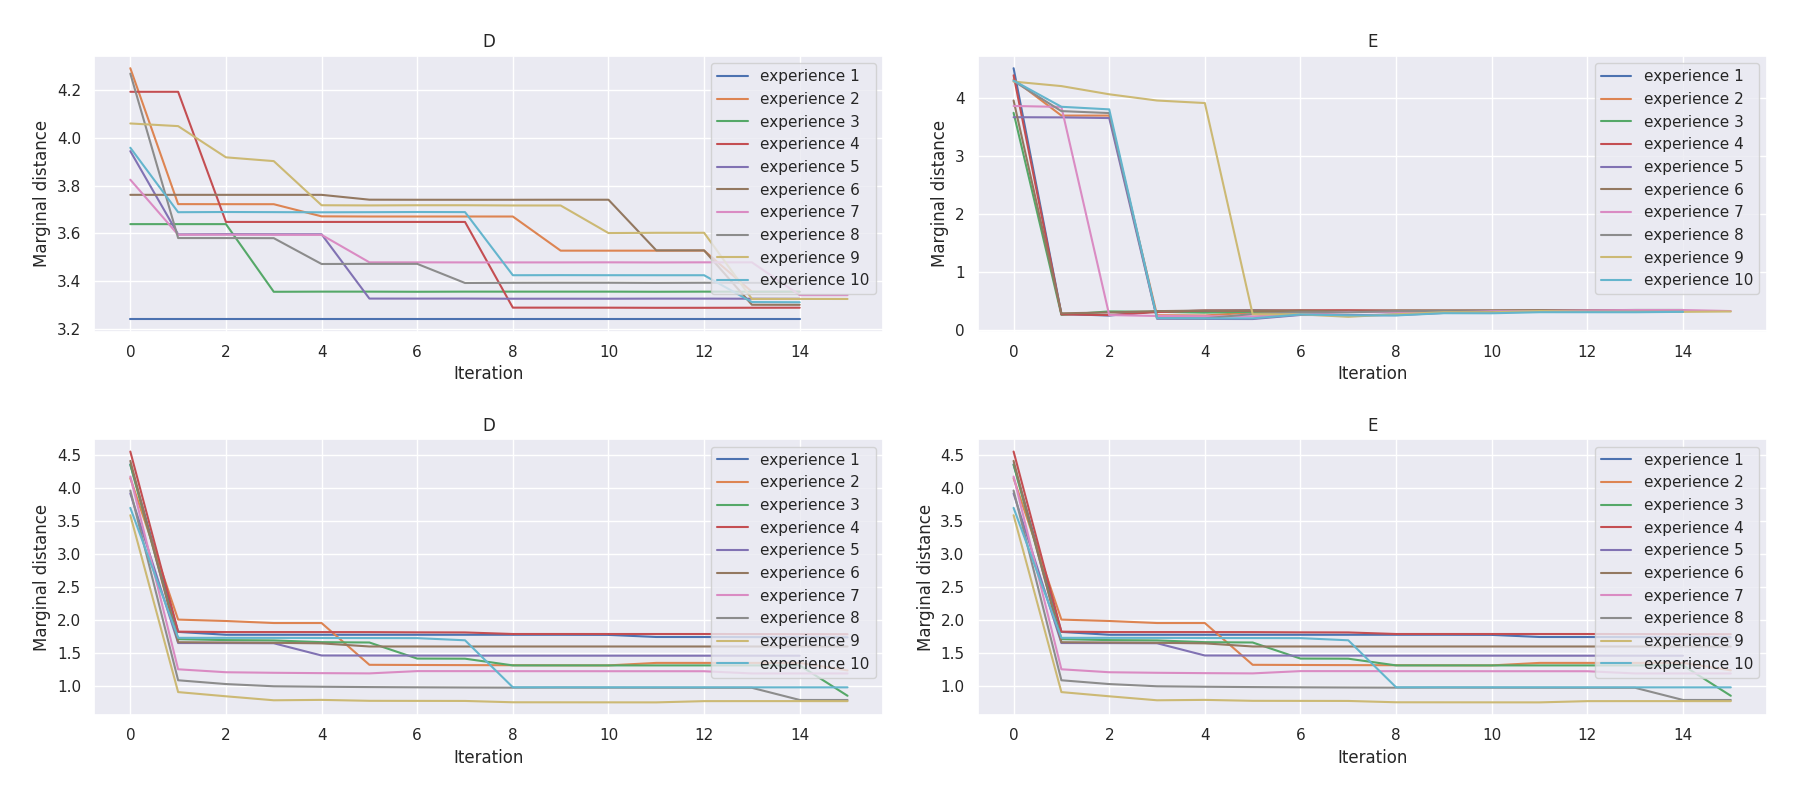
t-plots: DTF-MO (top), DTF-2SO (bottom) |
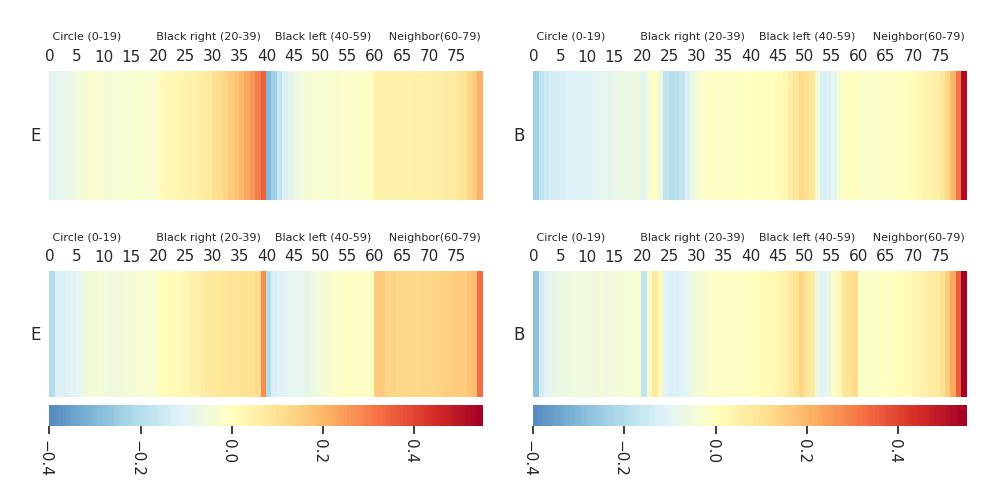
Heatmaps: DTF-MO (top), DTF-2SO (bottom) |
 |
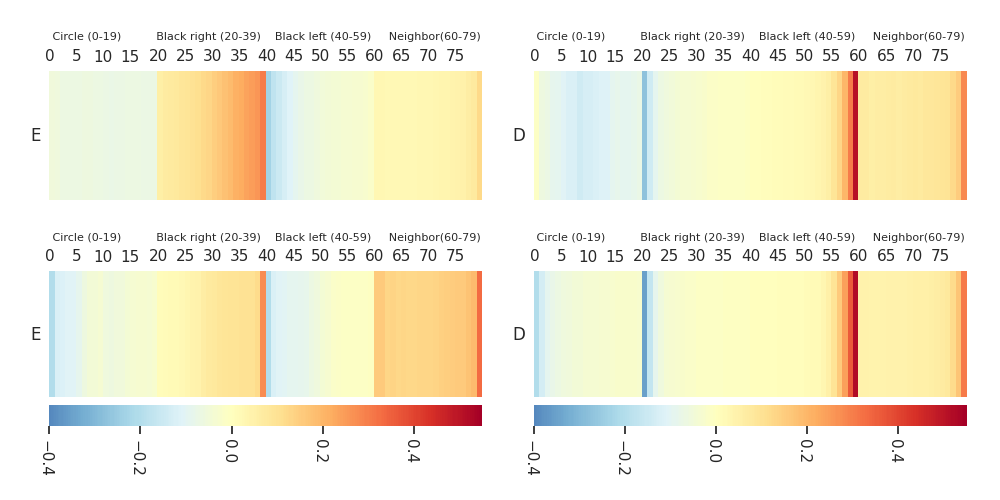 |
Mission D·E |
|
Baseline control software |
Quantitative results |
 |
 |
t-plots: DTF-MO (top), DTF-2SO (bottom) |
Heatmaps: DTF-MO (top), DTF-2SO (bottom) |
 |
 |
The PFSM of instances of each sequence are available for download.
The code and installation instructions are available for download.
Videos of some generated behaviors are available online.