by Lorenzo Garattoni, Andrea Roli, Carlo Pinciroli, Matteo Amaducci, and Mauro Birattari
DATE: March 2013
|
Table of Contents |
Abstract
We propose an approach to the automatic synthesis of robot control software based on the finite state machine (FSM) formalism. In our previous research, we have introduced Boolean network robotics as a novel approach to the automatic design of robot control software. In this paper, we show that it is possible to leverage automatically designed Boolean networks to synthesize FSMs for robot control. Boolean network robotics exhibits a number of interesting properties. Firstly, notwithstanding the large size of the state space of a Boolean network and its ability to display complex and rich dynamics, the automatic design is able to produce networks whose trajectories are confined in small volumes of the state space. Secondly, the automatic design produces networks in which one can identify clusters of states associated with functional behavioral units of the robots.
It is our contention that the automatic design of a Boolean network controller can be a convenient intermediate step in the synthesis of a FSM, which offers the advantage of being a compact, readable, and modifiable representation.I n this paper, we show that clusters of states traversed by network trajectories can be mapped to states of a FSM. We illustrate the viability of our proposal in two notable robotic tasks, namely collision avoidance and sequence-recognition. The first task can be achieved by a memoryless control program, whilst in the second the robots need memory. We conclude the paper with some insights on how to define a fully automatic method for synthesizing FSMs starting from Boolean networks.
TOP
STATE SPACE USAGE
The following plot reports the distribution of the number of states utilized by the trained networks for the corridor-navigation test case. The data has been obtained by collecting the trajectories of the networks during 200 runs with different initial conditions and counting the number of states visited during along all the trajectories.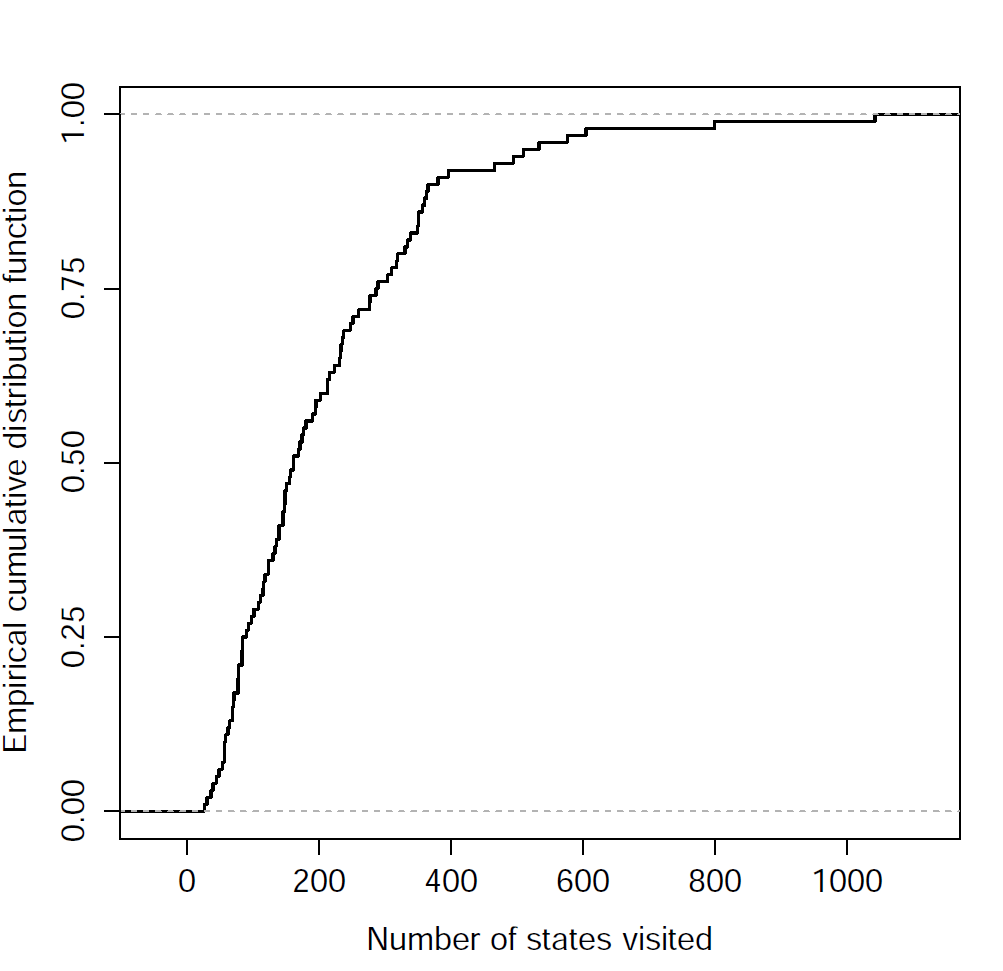
TOP
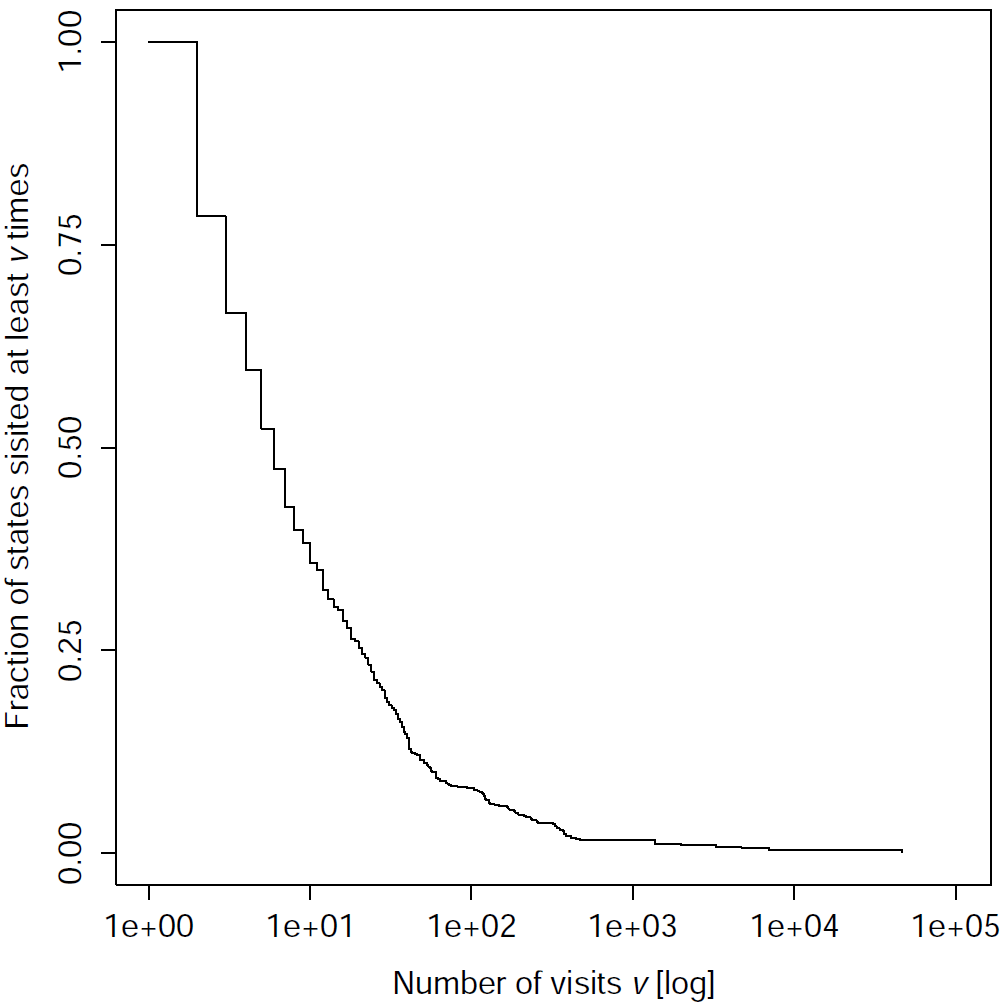
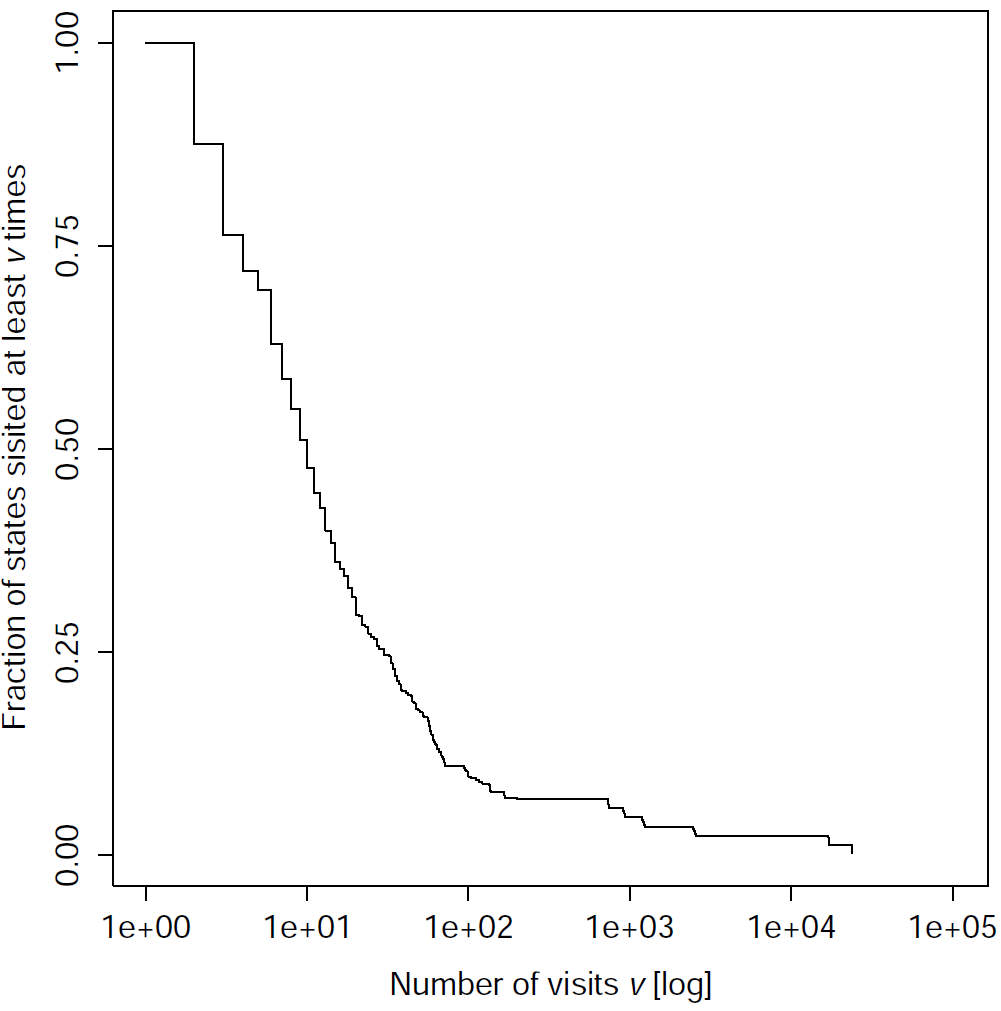
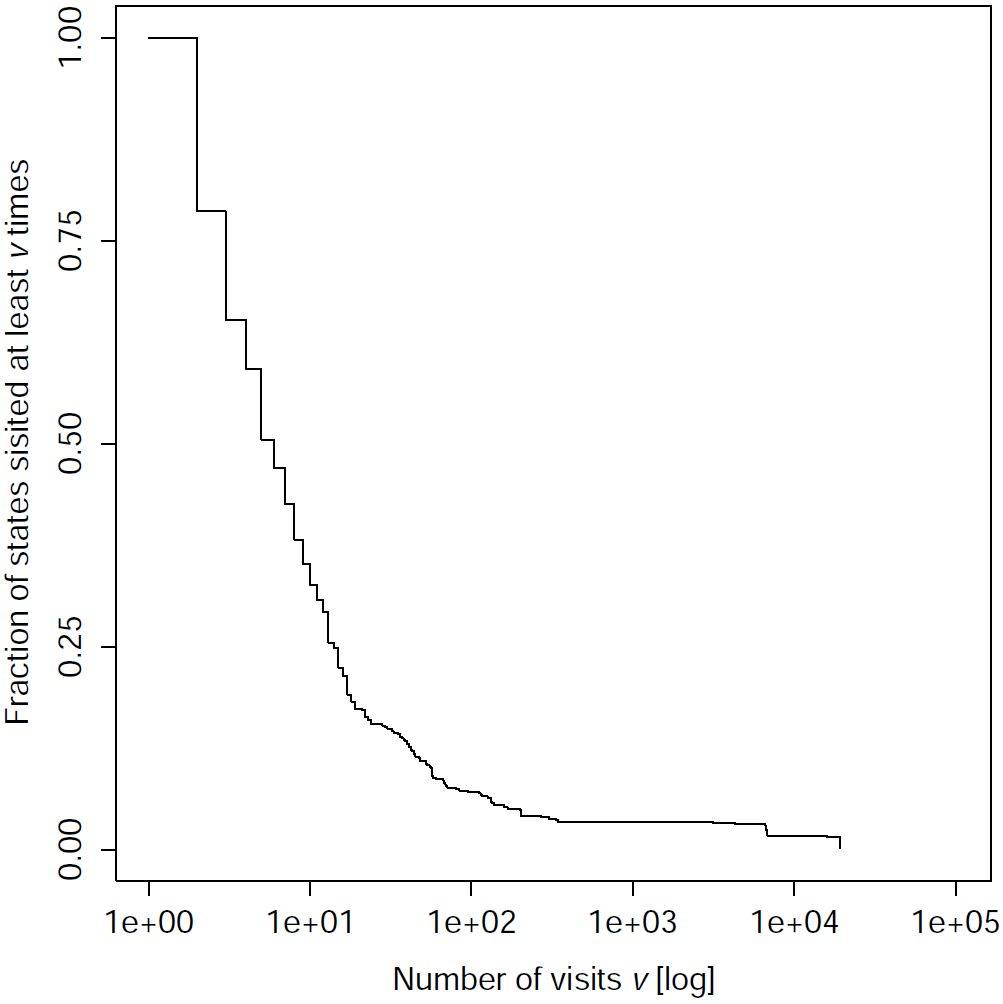
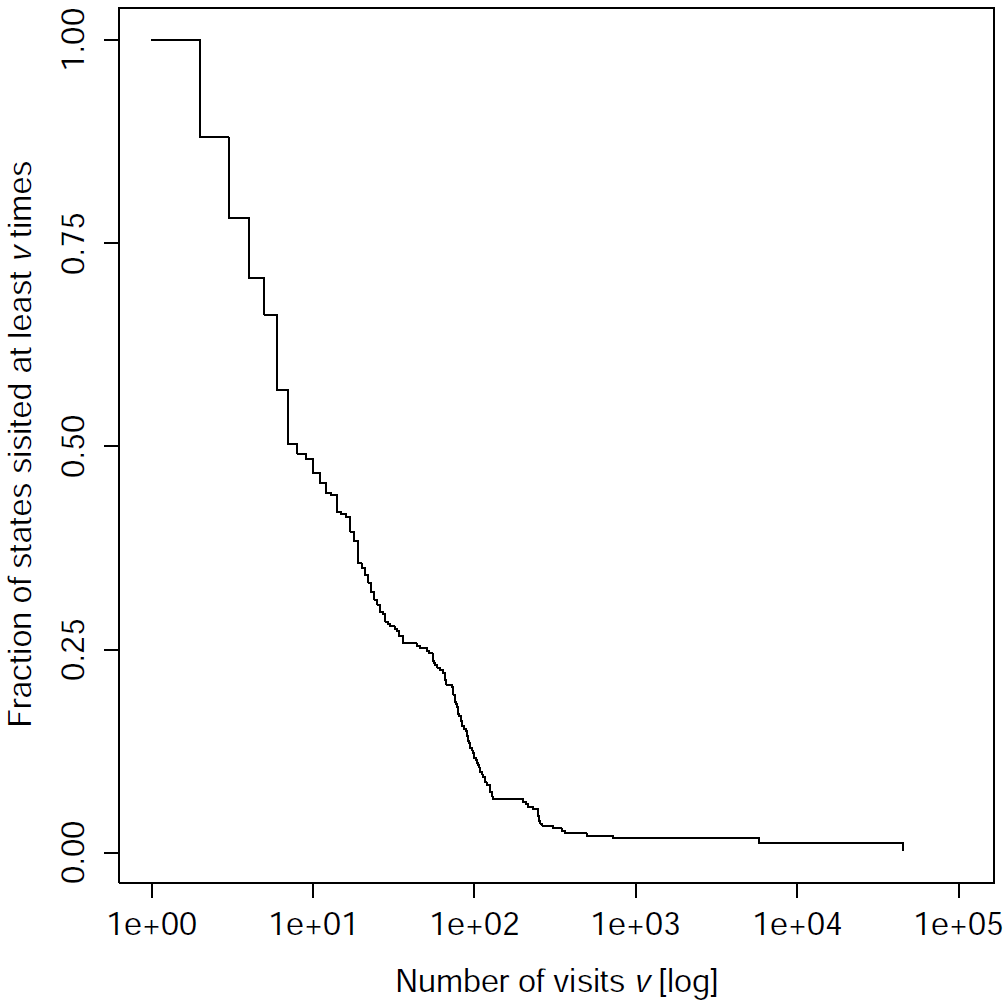
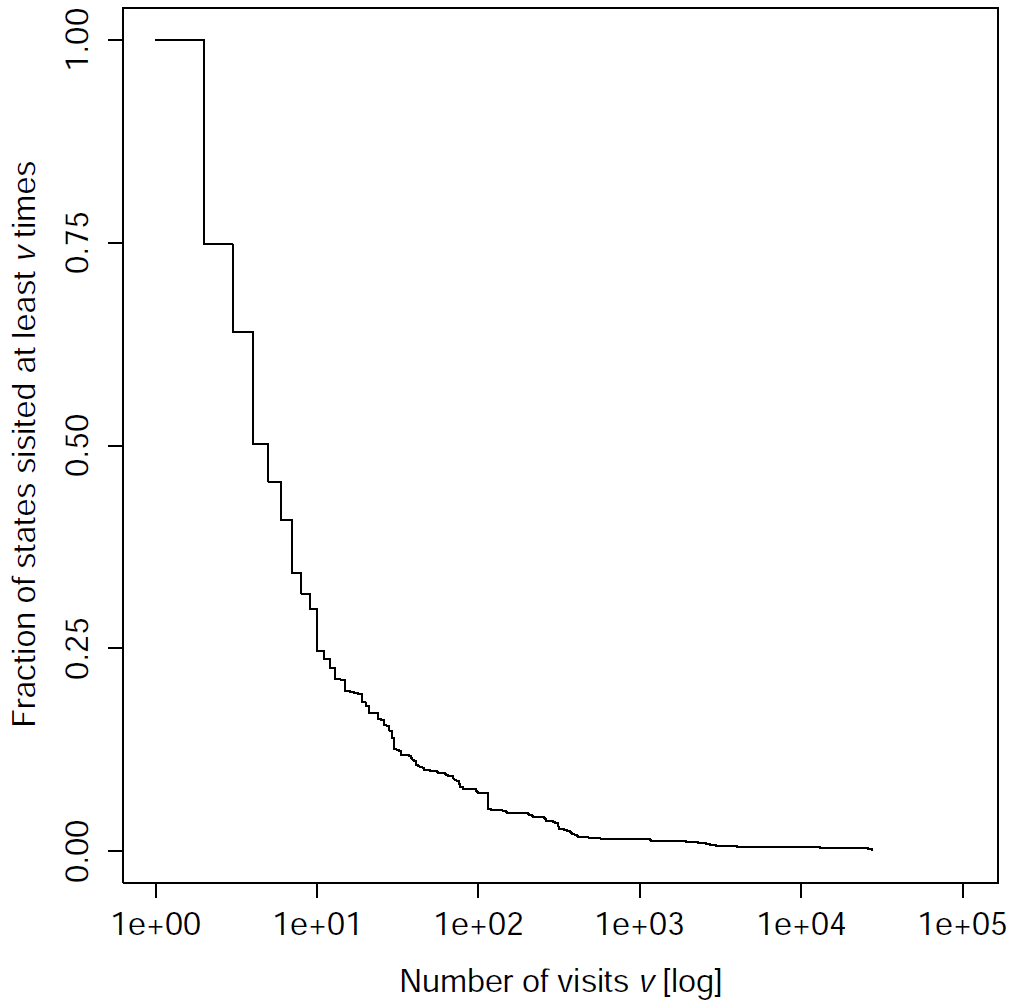
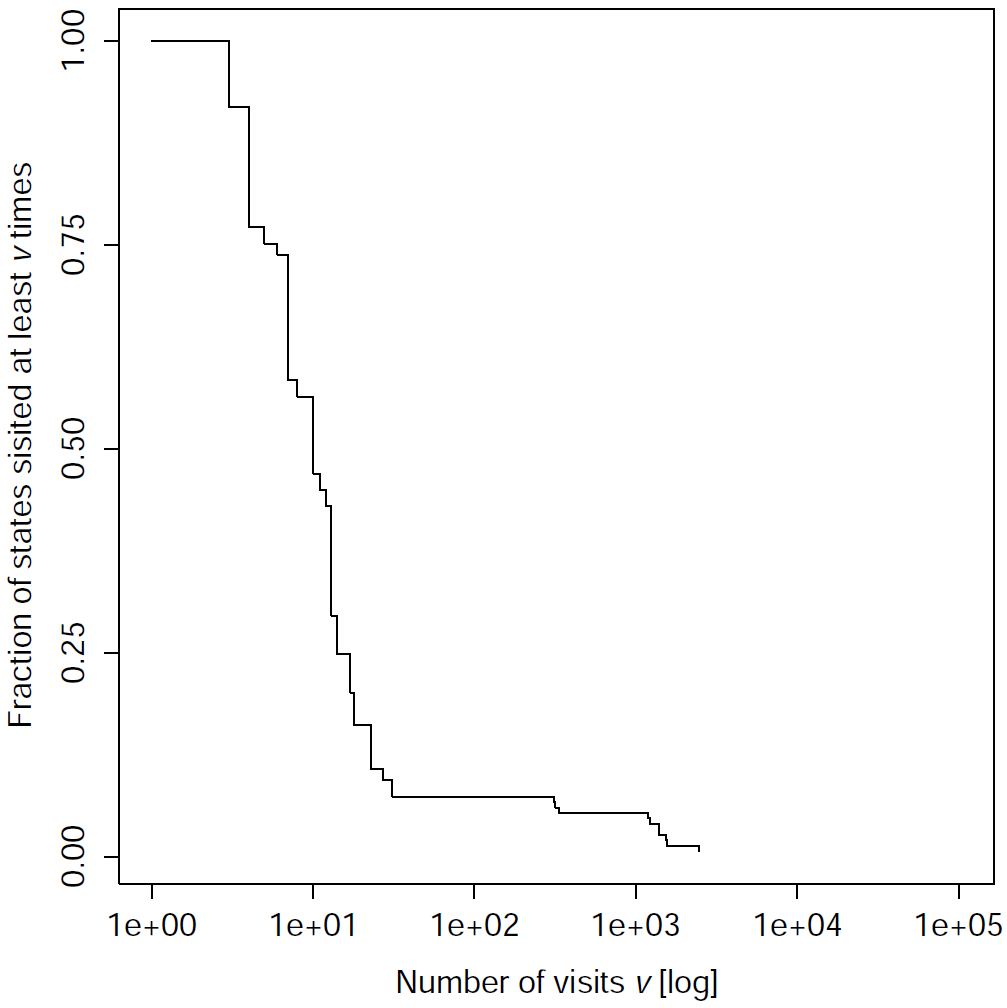
STATES AND NUMBER OF VISITS
We collected the trajectories of the network by simulating the experiment. Then, we gathered the trajectories and generated the graph of the observed state transitions. The analysis was performed on the graph of all the final networks of the corridor-navigation test case, and on some of the final networks performing sequence recognition. The following plots show the cumulative distribution of the fraction of states visited at least v times, where v is the number of visits on the x-axisCorridor navigation | |
|---|---|
 |
 |
 |
 |
Sequence recognition | ||
|---|---|---|
 |
 |
|
TOP
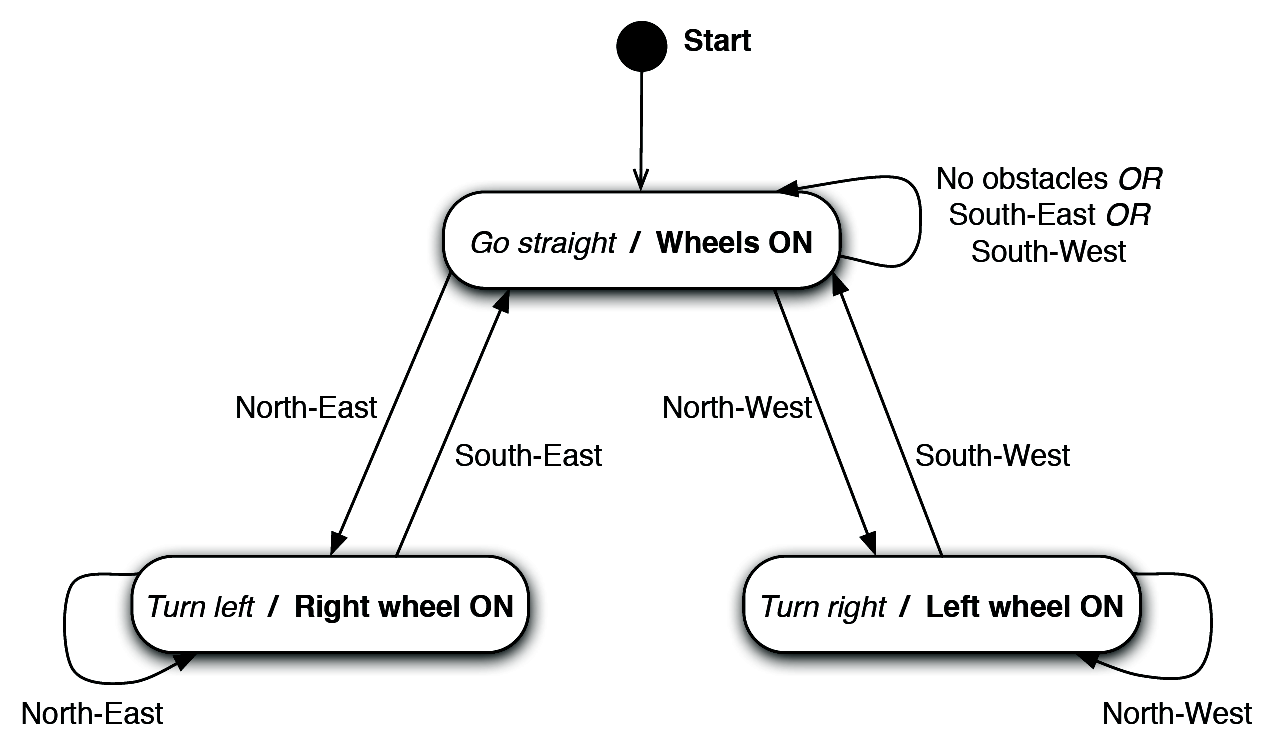
FROM BN TO FSM
We collected the trajectories of the networks by simulating the experiment. Then, we gathered the trajectories and generated the graph of the observed state transitions. Thanks to the observation that the graph of the networks is built around few, topical states that represent the main traits of the robot behavior, we derived a compact representation of the robot's software in terms of FSMs. In the following we report the graph of the trajectories and the derived FSM for a network performing corridor navigation and one performing sequence recognition.FSM corridor navigation
| To open the graph of the state transitions of the network performing corridor navigation click here |
|
|
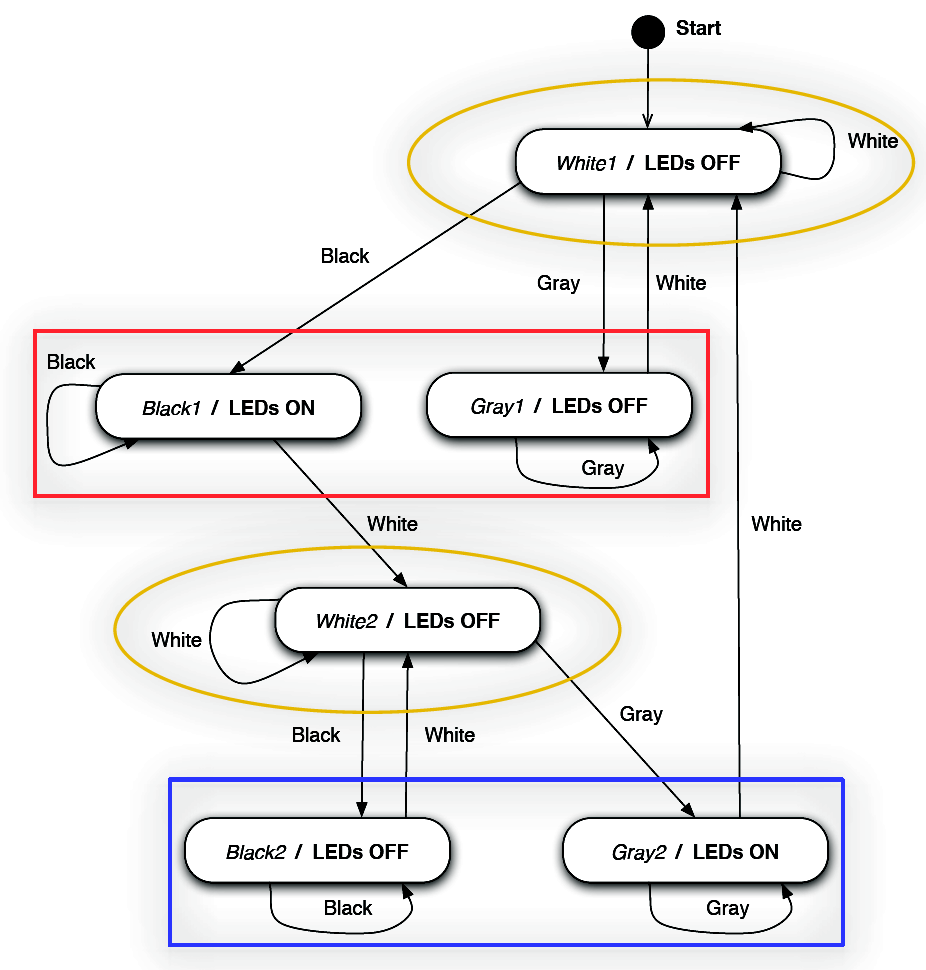
FSM sequence recognition
| To open the graph of the state transitions of the network performing sequence recognition click here |
|
|
TOP
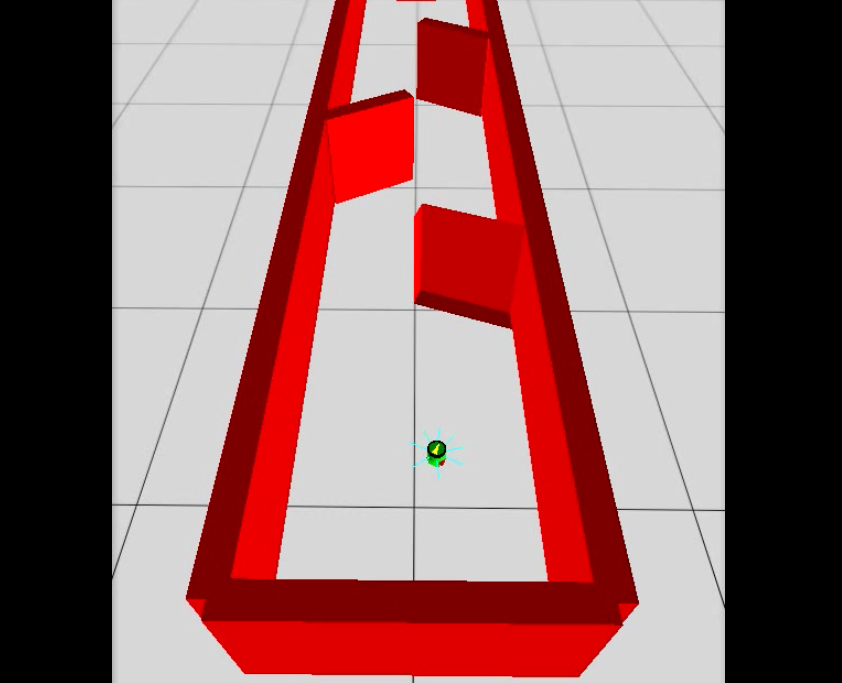
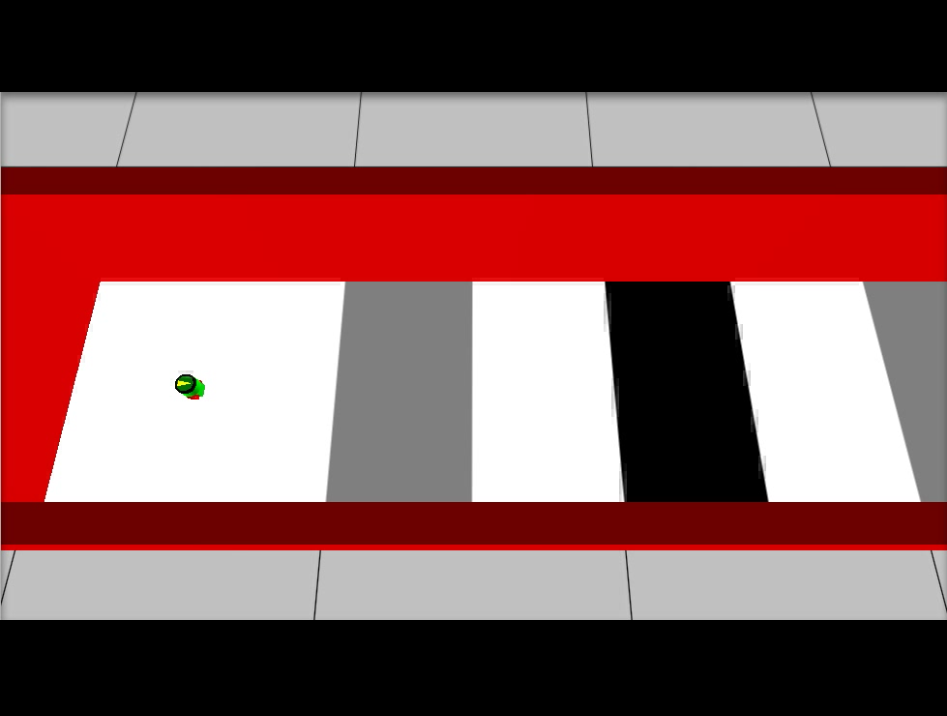
VIDEO - TESTING
The videos show the testing phase of both networks performing corridor navigation and sequence recognition.| Corridor navigation | Sequence recognition |
|
|
TOP