Incremental Social Learning Applied to Robot Swarms
Chapter 5 of Incremental Social Learning in Swarm Intelligence Systems
Shortest Path Selection
This video shows the collective decision-making process that results from the application of the majority-rule opinion dynamics model with differential latency.
The environment consists of two areas between which the robots must transport objects collectively. These two areas are at the top and bottom parts of a video frame. Connecting these two areas there are two corridors of different length. Each team of robots must choose between these two corridors to go to the target area. At each decision point, there is an LED that helps robots know in which direction to turn. For simplcity, objects are removed from the simulation as soon as they are transported to the target area. Something similar happens with robots once they go back to the starting area.
In this example, a population of 32 robots and 8 teams are used. Initially, 16 robots prefer the left path and 16 robots prefer the right path. Every time a team is formed (at random), the local majority determines which path the team will follow. At the end of the simulation the population achieves consensus on the left path. Note: The speed of the video is 4 times the normal speed of the simulation.
Download the video in AVI format.
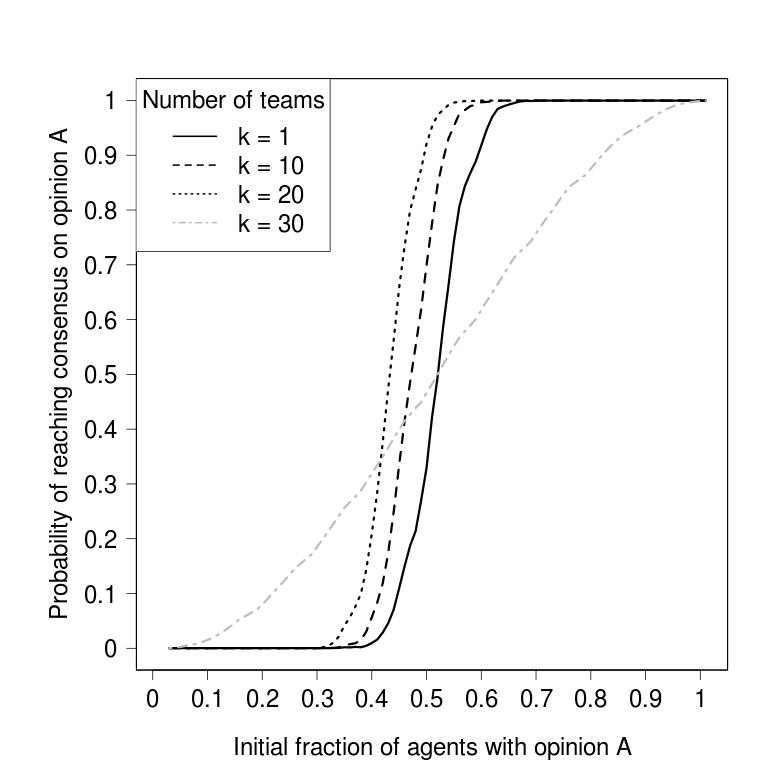
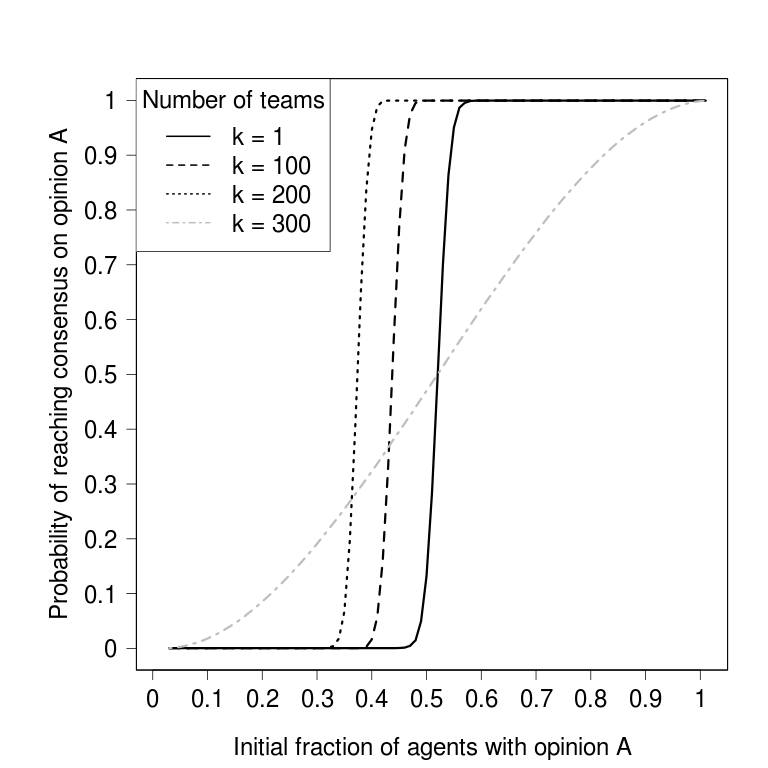
Probability of Reaching Consensus
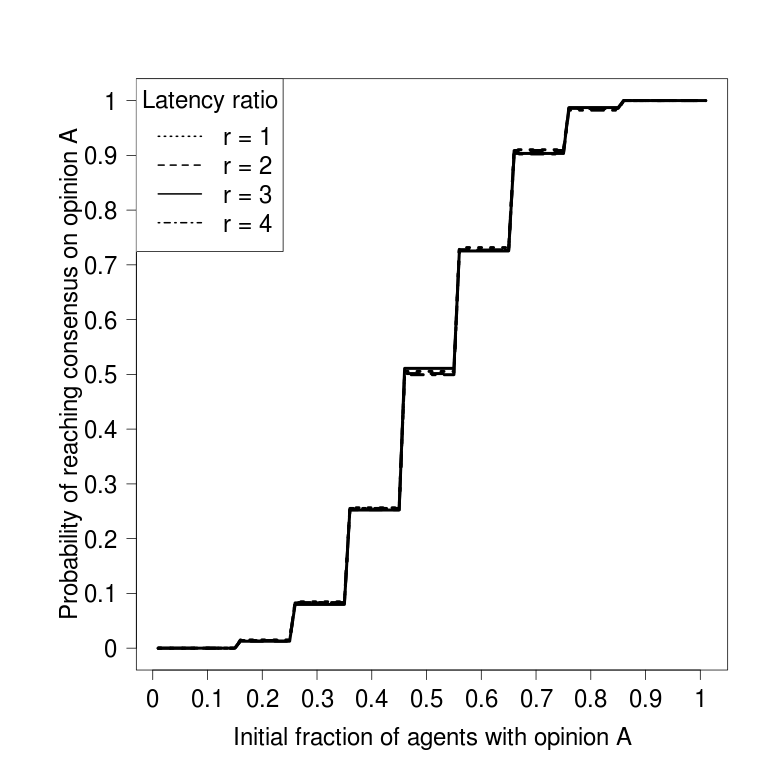
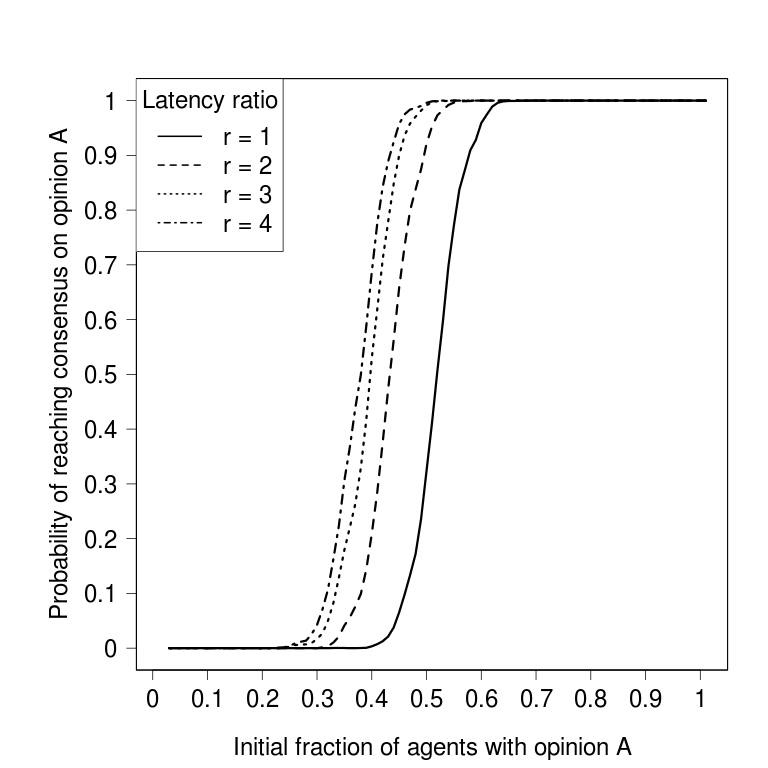
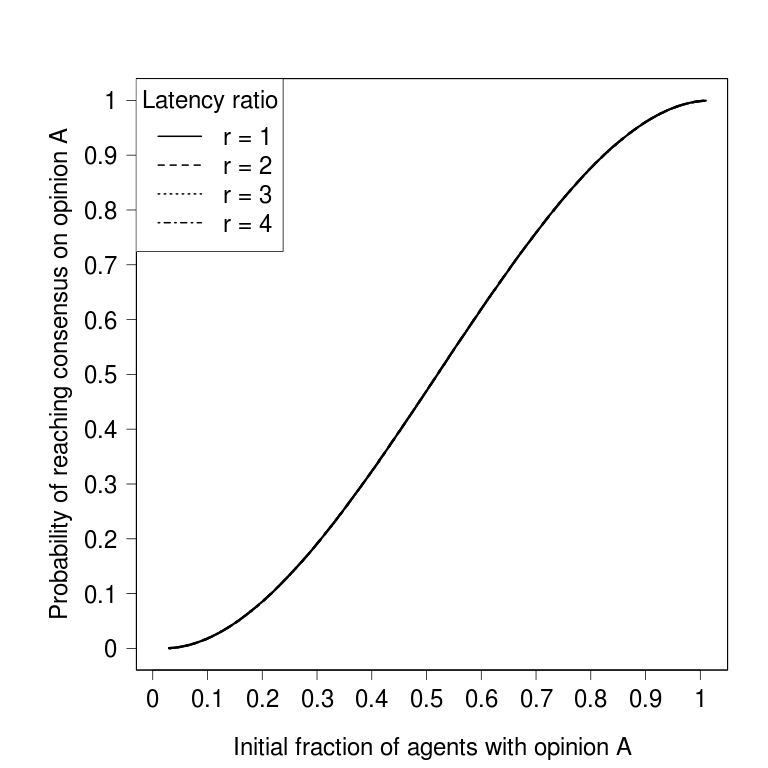
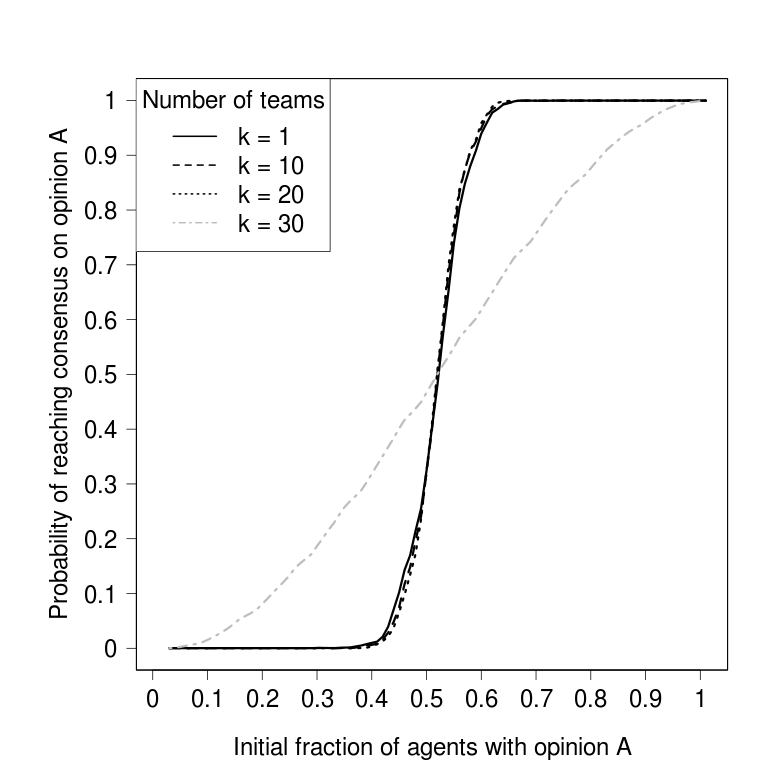
The following figures show the probability of reaching consensus as
a function of the initial fraction of agents favoring the opinion associated with the shortest latency period.
Results grouped by the ratio of the duration of latency periods
Results grouped by the number of teams
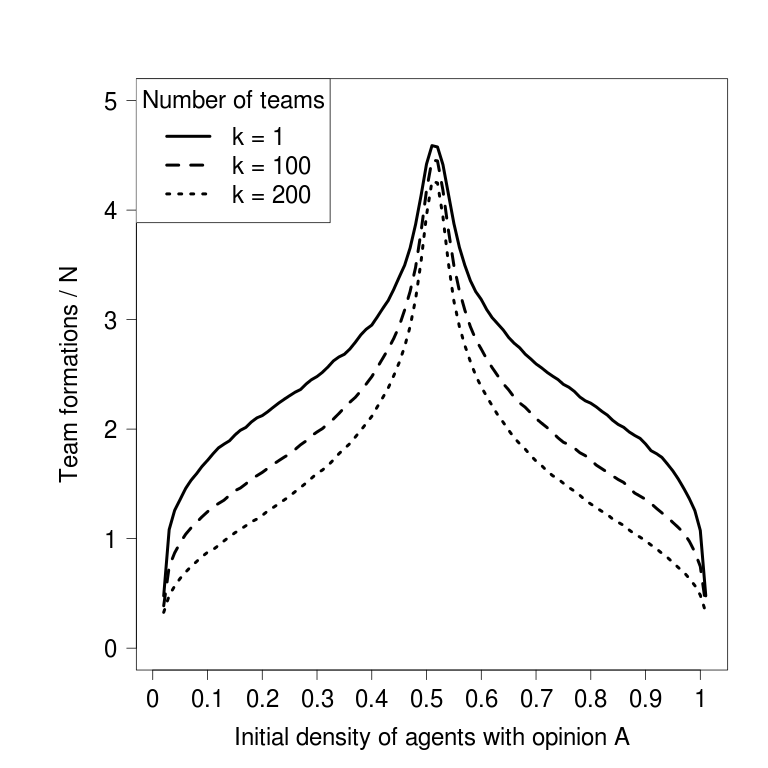
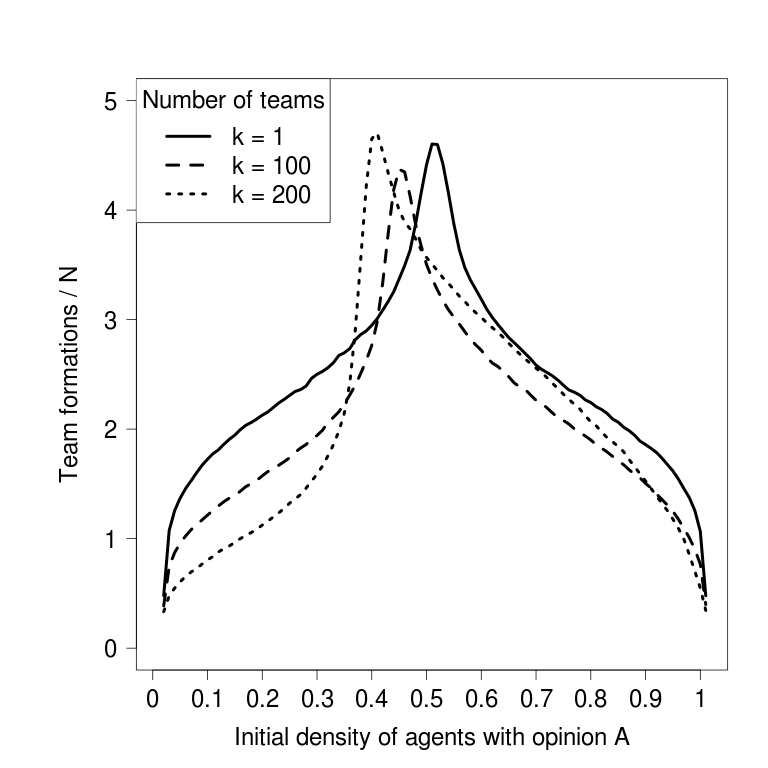
Number of Team Formations needed to reach Consensus
The following figures show the average number of team formations needed to reach consensus as
a function of the initial fraction of agents favoring the opinion associated with the shortest latency period.
Results grouped by the ratio of the duration of latency periods
Results grouped by the number of teams
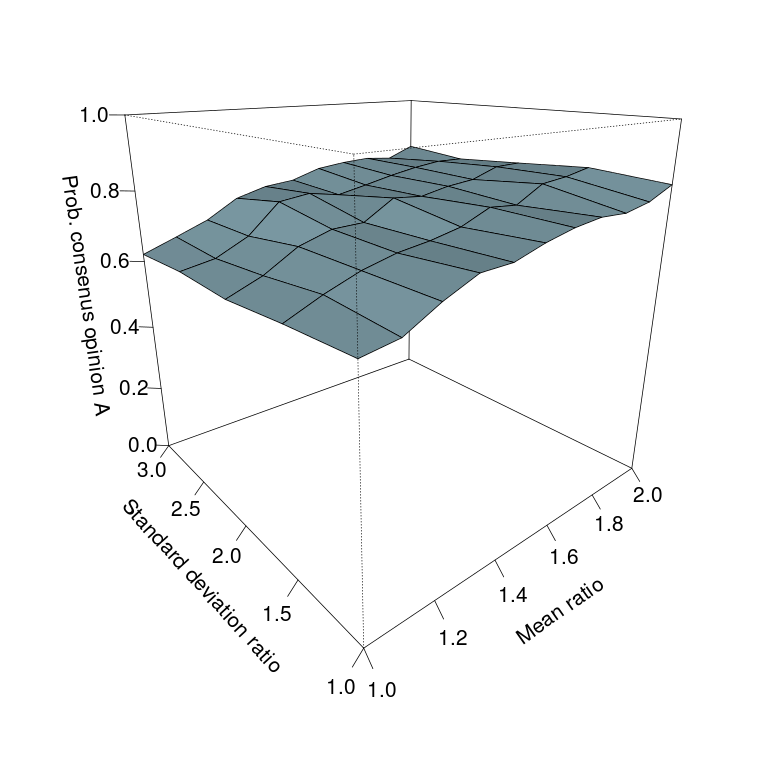
Discrimination Ability
The probability of reaching consensus on the opinion associated
with the shortest latency period and the average number of team formations
needed to do it as a function of different levels of overlap between latency period
duration distributions.