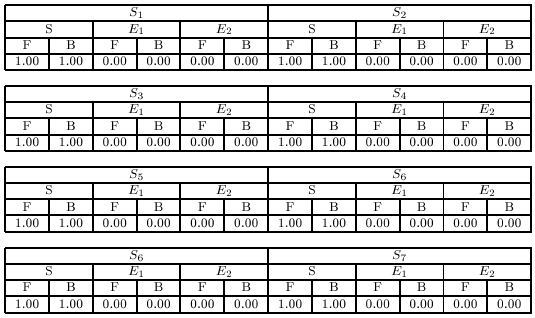
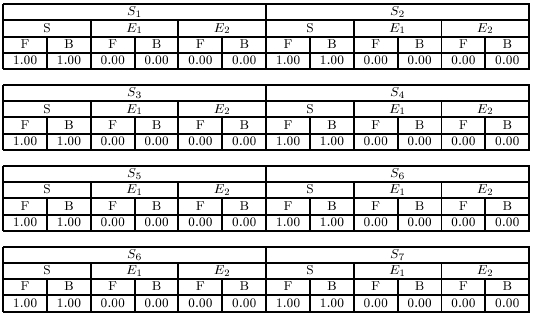
INDIVIDUAL LEARNING POST-EVALUATIONS (SEEDING CHROMOSOMES)
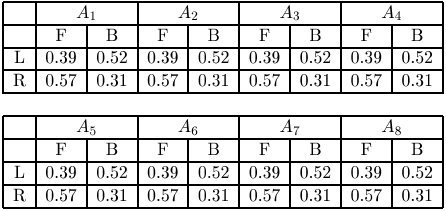
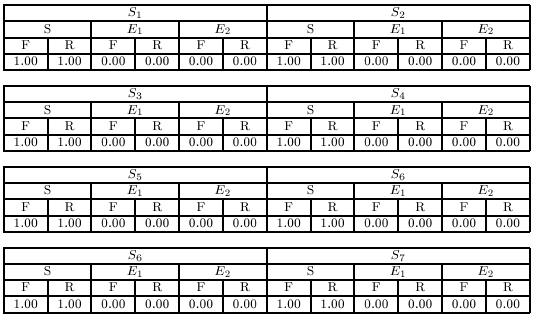
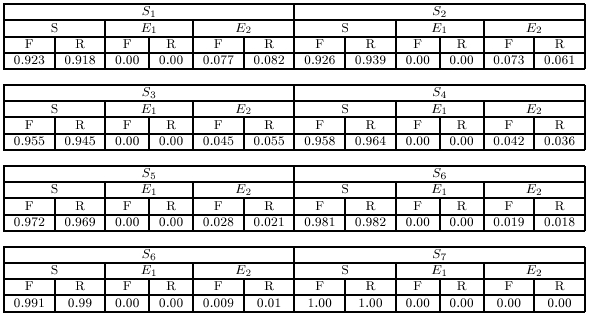
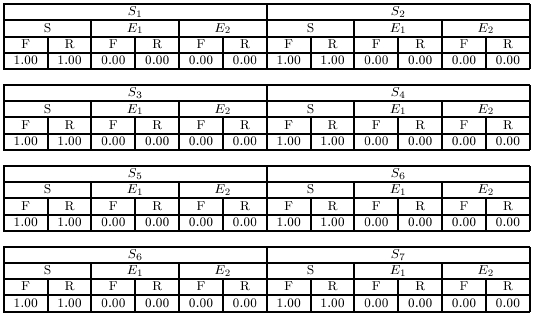
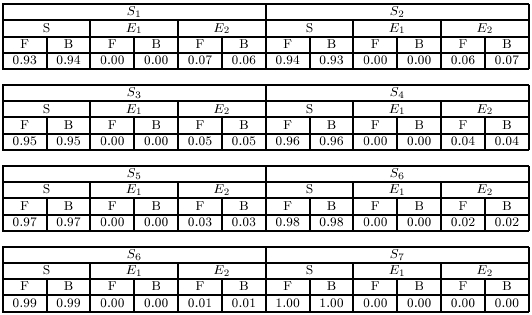
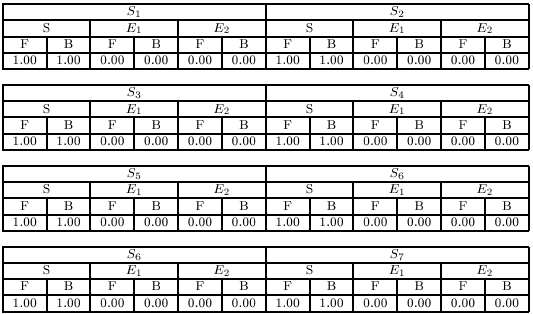
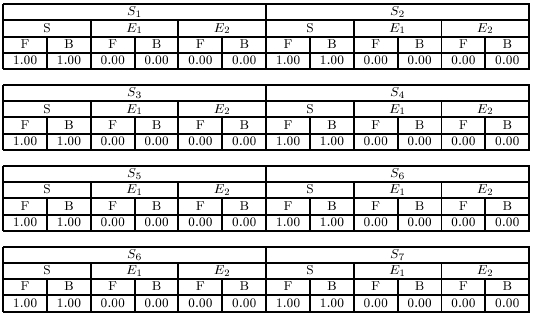
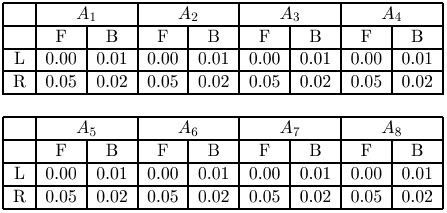
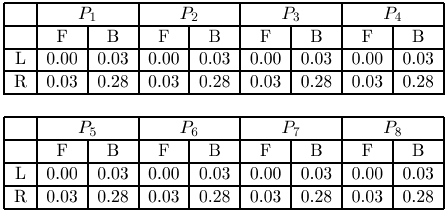
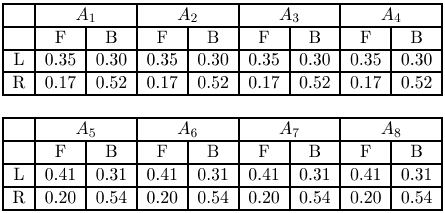
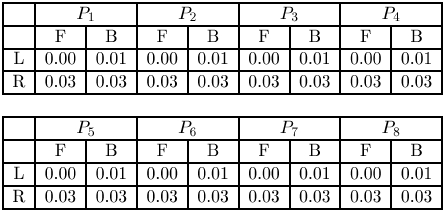
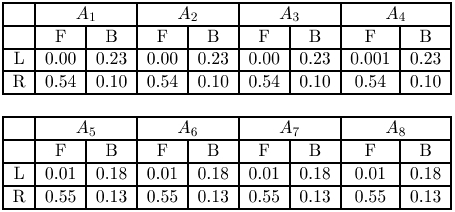
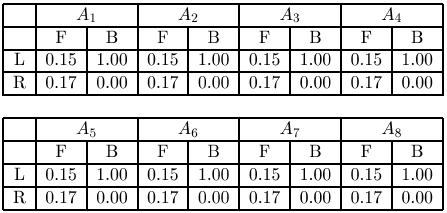
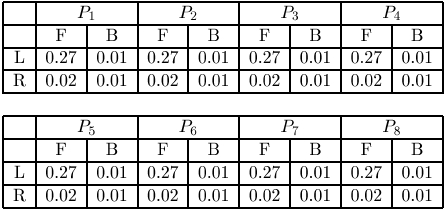
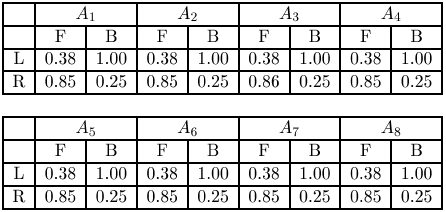
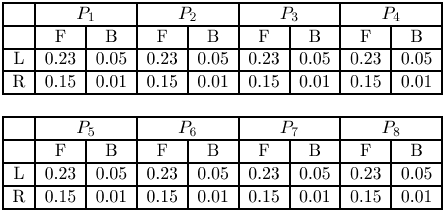
The following tables show the evaluation results of the 3 seeding chromosomes, each has been used to create 4 different generations of 80 individuals, used as starting point for the evolution of social learning behaviour (see section 7.2 of the paper for more details). Columns labelled with Si indicates the different kind of sets of 8 trials: from S1 with sound played the first trial in the set to S8, with sound played the last one. After 8 trials the controller is reset (neuron's states set to 0) and the robots forgets what learned. A phototaxis trial is successful if the robot reaches a distance from the light smaller than 5cm, antiphototaxis trials are successful when the robt get farther than a time and an half the initial distance. Column S indicates the success rate, E1 and E2, indicate respectively the type 1 error rate (the robot should do phototaxis but doesn't) and the type 2 error rate (the robot should perform antiphototaxis but follows the light). Finally F and R indicate the robot relative orientation with respect to the light source: F indicates situations in wich the robot starts by facing the light, B indicates that the light is behind the robot when the trial starts. For more details see section 8.1 of the paper. Each set Si has been repeated 1000 times, so for each set the robot goes through 8000 trials.
Demonstrator 1
Demonstrator 2
Demonstrator 3
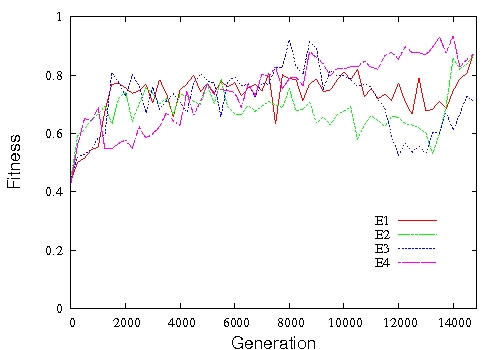
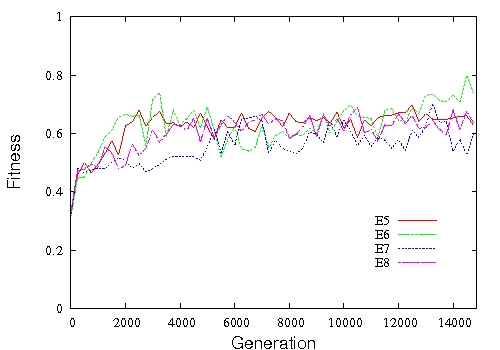
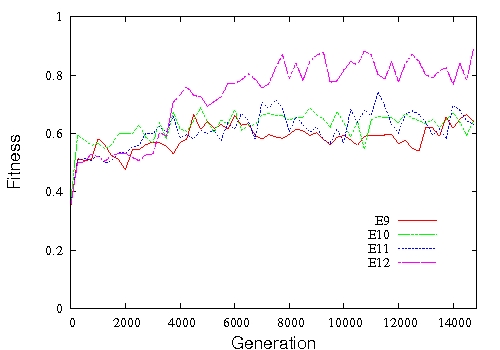
SECOND EVOLUTIONARY PHASE
The following graphs show the fitness score of the best individuals of all the second phase evolutionary runs (see section 7.2 of the paper). Each plot refers to the 4 evolutionary runs generated using the same seeding chromosome.
Evolutionary runs 1-4
Generated from Demonstrator 1
Evolutionary runs 5-8
Generated from Demonstrator 2
Evolutionary runs 9-12
Generated from Demonstrator 3
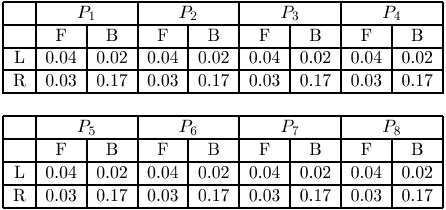
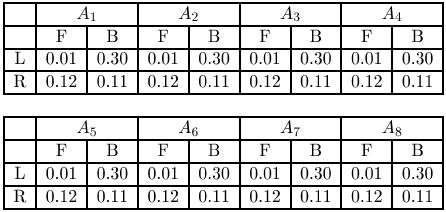
INDIVIDUAL LEARNING EVALUATION (LEARNERS)
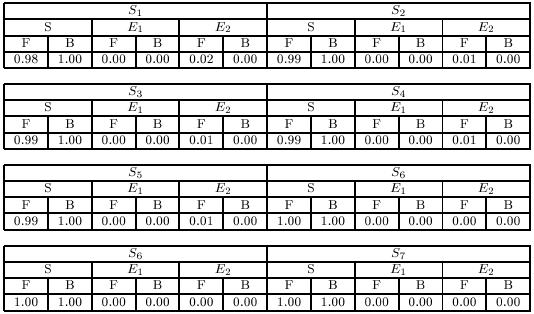
The following tables show the post-evaluation results of all the 12 learners, in the individual learning task. The post-evaluation procedure and the meanings of the labels are described here. Data about learners 1, 2, 3, and 4 can be found also in the paper (section 8.1).
Learner 1
(best individual of evolutionary run 1)
Learner 2
(best individual of evolutionary run 2)
Learner 3
(best individual of evolutionary run 3)

Learner 4
(best individual of evolutionary run 4)
Learner 5
(best individual of evolutionary run 5)
Learner 6
(best individual of evolutionary run 6)

Learner 7
(best individual of evolutionary run 7)
Learner 8
(best individual of evolutionary run 8)

Learner 9
(best individual of evolutionary run 9)

Learner 10
(best individual of evolutionary run 10)

Learner 11
(best individual of evolutionary run 11)

Learner 12
(best individual of evolutionary run 12)
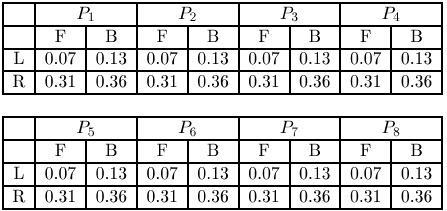
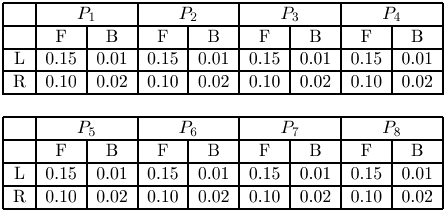
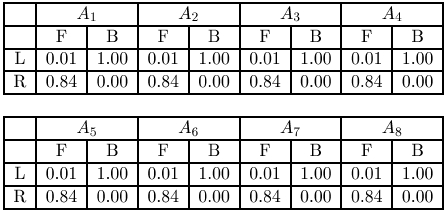
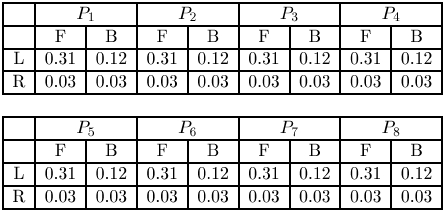
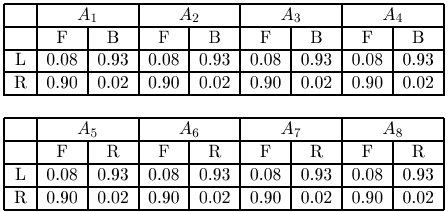
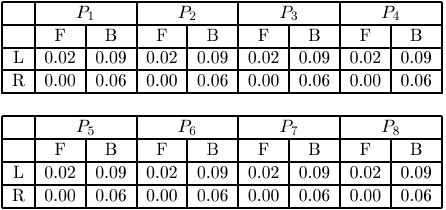
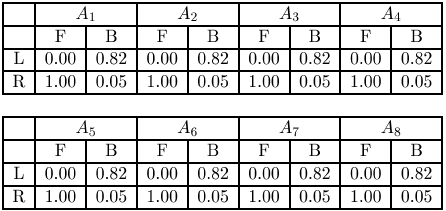
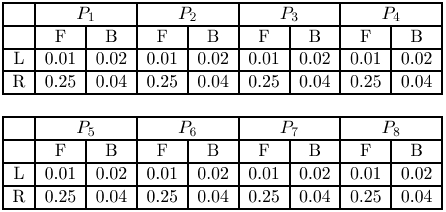
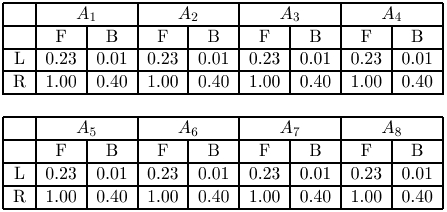
SOCIAL LEARNING EVALUATION (LEARNERS)
Learner 1
(phototaxis performances)
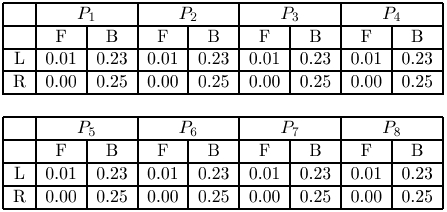
Learner 1
(antiphototaxis performances)
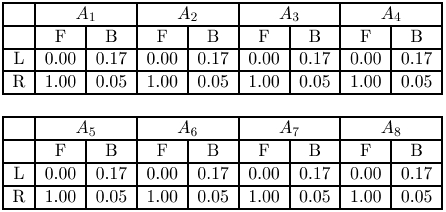
Learner 2
(phototaxis performances)
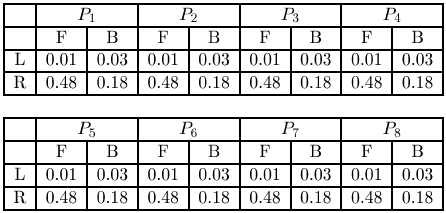
Learner 2
(antiphototaxis performances)
Learner 3
(phototaxis performances)
Learner 3
(antiphototaxis performances)
Learner 4
(phototaxis performances)
Learner 4
(antiphototaxis performances)
Learner 5
(phototaxis performances)
Learner 5
(antiphototaxis performances)
Learner 6
(phototaxis performances)
Learner 6
(antiphototaxis performances)
Learner 7
(phototaxis performances)
Learner 7
(antiphototaxis performances)
Learner 8
(phototaxis performances)
Learner 8
(antiphototaxis performances)
Learner 9
(phototaxis performances)
Learner 9
(antiphototaxis performances)
Learner 10
(phototaxis performances)
Learner 10
(antiphototaxis performances)
Learner 11
(phototaxis performances)
Learner 11
(antiphototaxis performances)
Learner 12
(phototaxis performances)
Learner 12
(antiphototaxis performances)