Supporting material for the article:
Estimation-based Local Search
for Stochastic Combinatorial Optimization
January 2007
1. Abstract:
In recent years, growing attention has been devoted to the development of metaheuristics and local search for tackling stochastic combinatorial optimization problems. This paper focuses on local search, which is particularly useful for improving the quality of the solutions found by metaheuristics. The effectiveness of a local search is greatly determined by the evaluation procedure that is used to select the best of several solutions in the presence of uncertainty. In this paper, we propose an effective evaluation procedure in which the solutions are evaluated by empirical estimation techniques. We illustrate our approach and assess its performance with the Probabilistic Travelling Salesman Problem. Experimental results on a large set of instances show that our approach can lead to a very fast and highly effective local search.
Keywords: Stochastic Combinatorial Optimization, Probabilistic Travelling Salesman Problem, Local Search, Iterative Improvement Algorithm, Empirical Estimation, Delta Evaluation
2. Algorithms:
- 2-p-opt and 1-shift: The state-of-the-art iterative improvement algorithms for PTSP
- 2.5-opt-ACs: 2.5-opt neighborhood exploration and neighborhood reduction techniques(fixed-radius search, candidate lists and don’t look bits) in the analytical computation framework.
- 2.5-opt-EEs: 2.5-opt neighborhood exploration and neighborhood reduction techniques(fixed-radius search, candidate lists and don’t look bits) in the empirical estimation framework.
- 2.5-opt-EEs-10: 2.5-opt-EEs with 10 realizations
- 2.5-opt-EEs-100: 2.5-opt-EEs with 100 realizations
- 2.5-opt-EEs-1000: 2.5-opt-EEs with 1000 realizations
- 2.5-opt-EEs-100-ri: 2.5-opt-EEs in which a set of realizations is sampled anew each time an improved solution is found
- 2.5-opt-EEs-100-rc: 2.5-opt-EEs in which a set of realizations is sampled anew for each comparision
- ILS-2.5-opt-ACs: Iterated local search with 2.5-opt-ACs
- ILS-2.5-opt-EEs: Iterated local search with 2.5-opt-EEs
- ILS-2.5-opt-EEs-100: ILS-2.5-opt-EEs with 100 realizations
- ILS-2.5-opt-EEs-1000: ILS-2.5-opt-EEs with 1000 realizations
3. PTSP Instances :
The problems considered are homogeneous PTSP instances obtained from TSP
instances generated by the DIMACS generator. We carried out experiments
with two classes of instances. In the first, nodes are uniformly distributed, in the
second they are clustered. For each of the two experiments, we consider 100 TSP
instances of size 100, 200, 300, and 1000 nodes. From each TSP instance we obtain
9 PTSP instances by letting the probability range in [0.1, 0.9] with a step size
of 0.1:
5. Experiments on neighborhood-reduction techniques
6. Experiments to assess the estimation approach
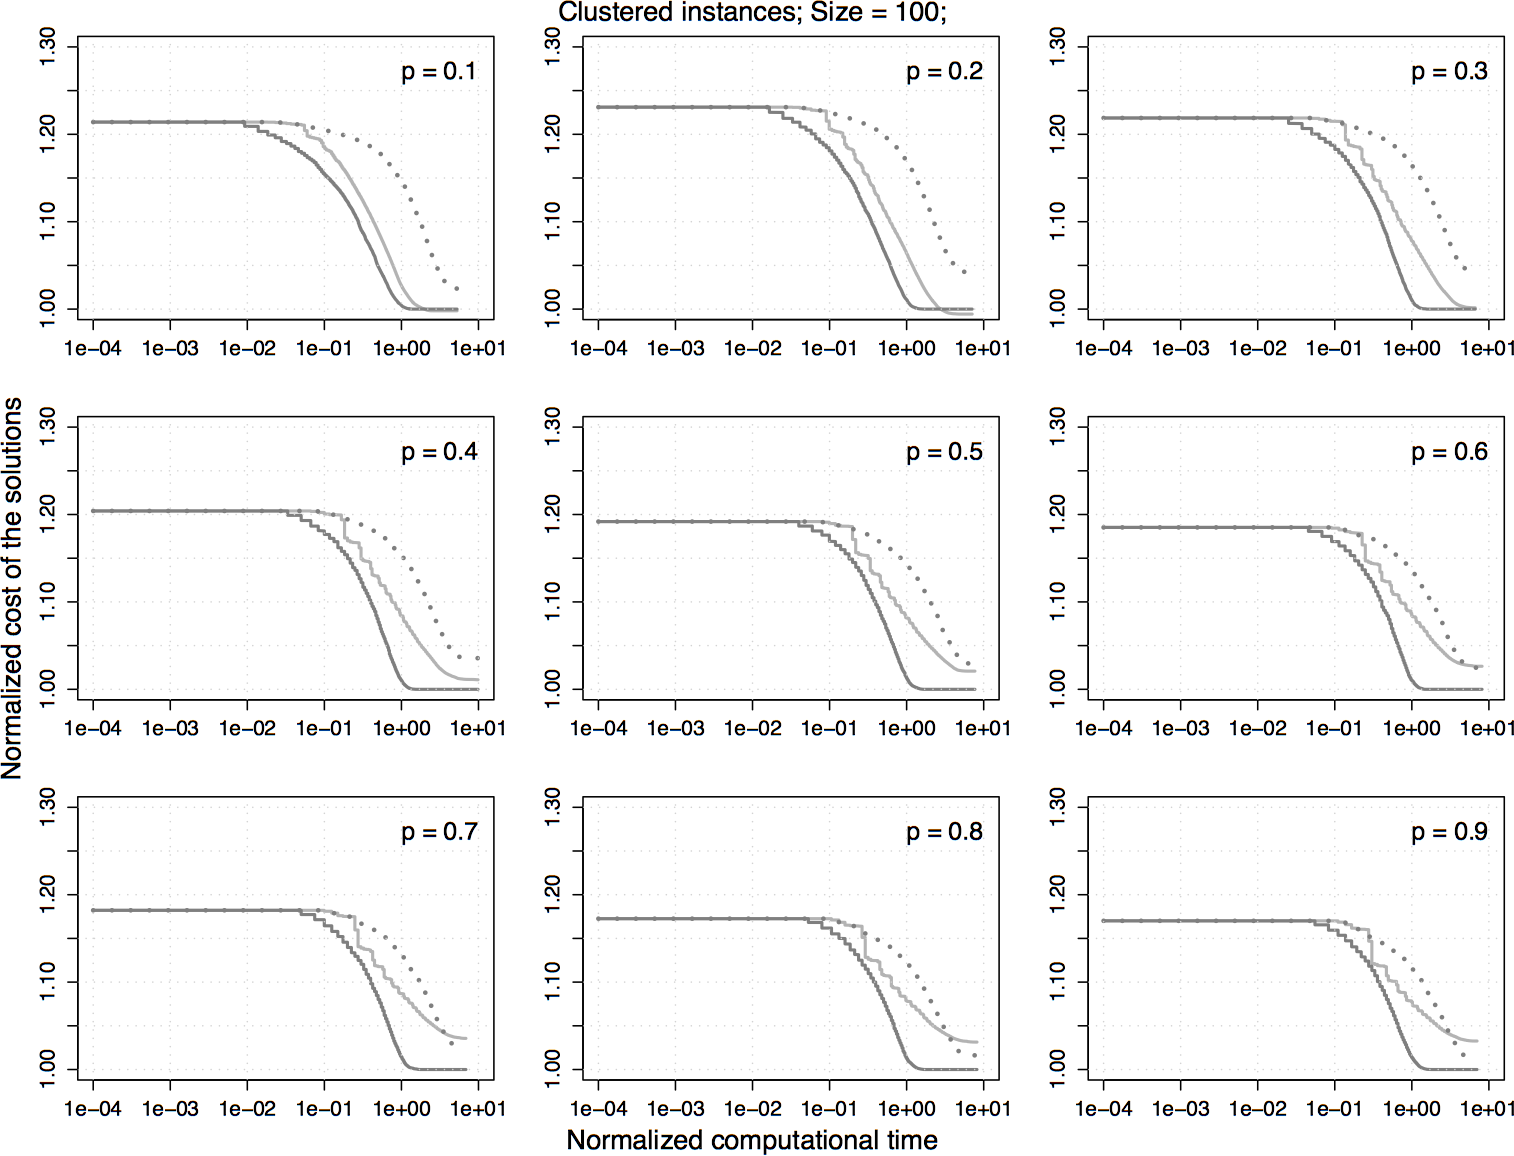
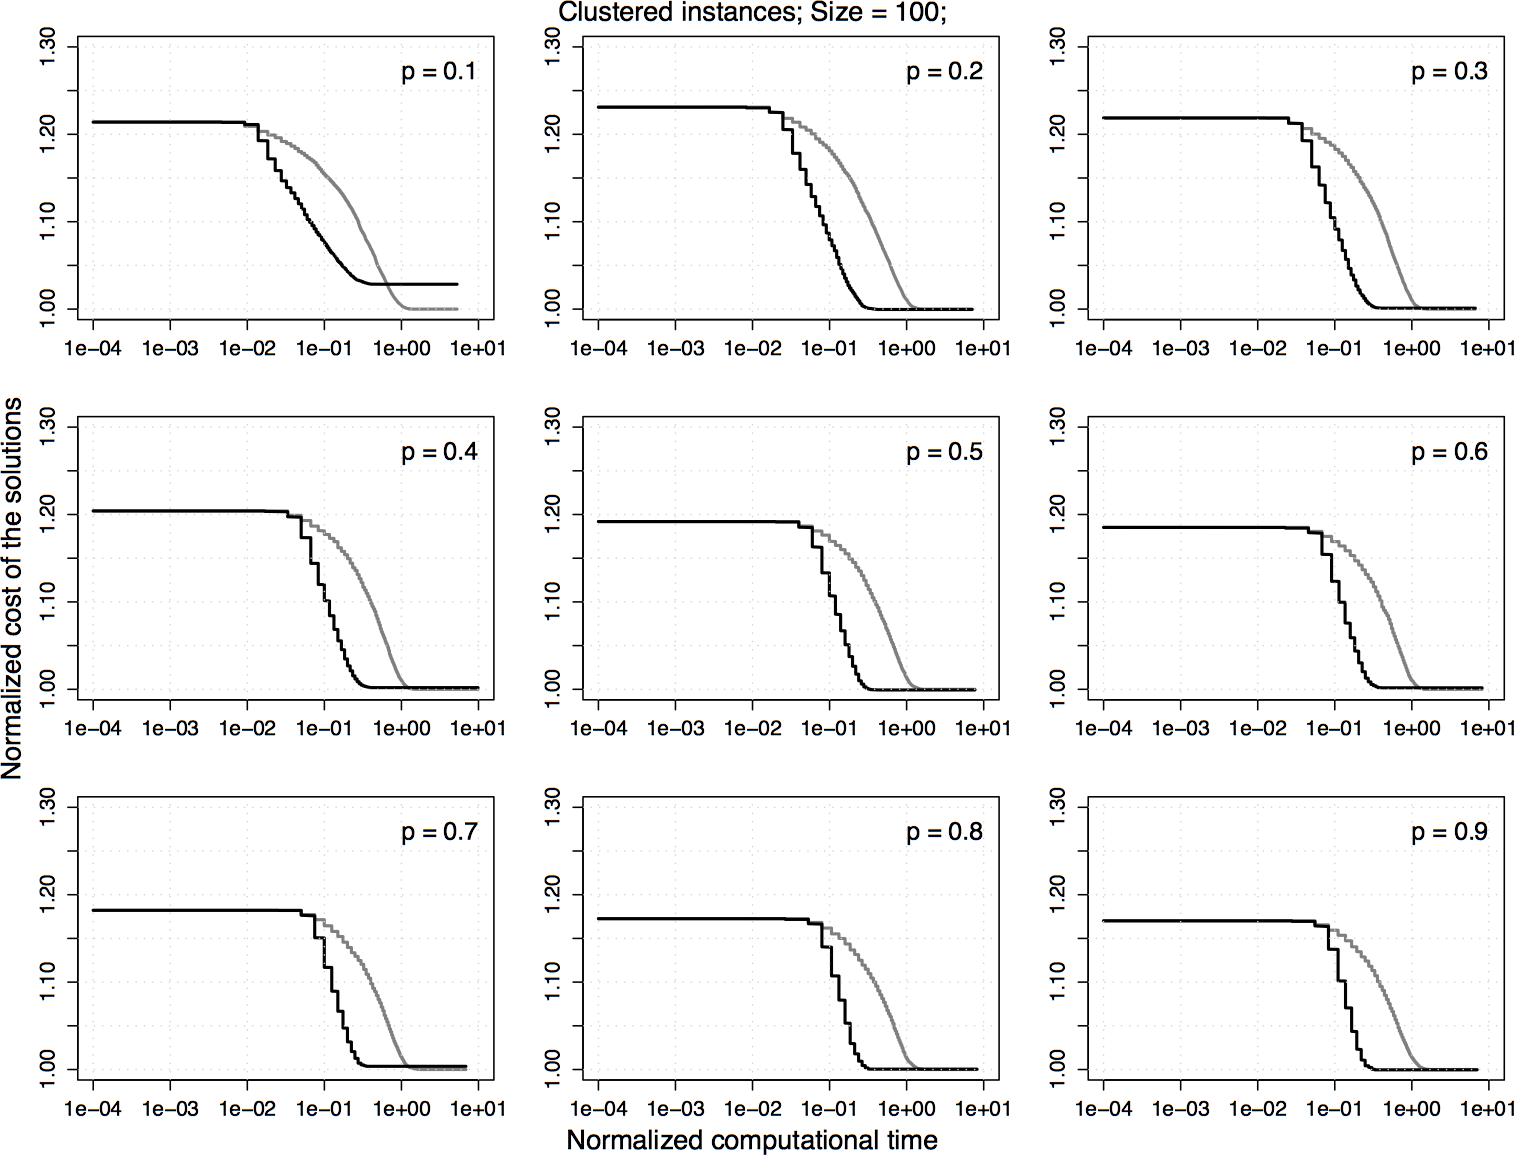
Experimental results on clustered homogeneous PTSP instances of size 100. The plots represent the average cost of the solutions obtained by 2.5-opt-EEs-100 normalized by the one obtained by 2.5-opt-ACs. Each algorithm is stopped when it reaches a local optimum.
 |
 |
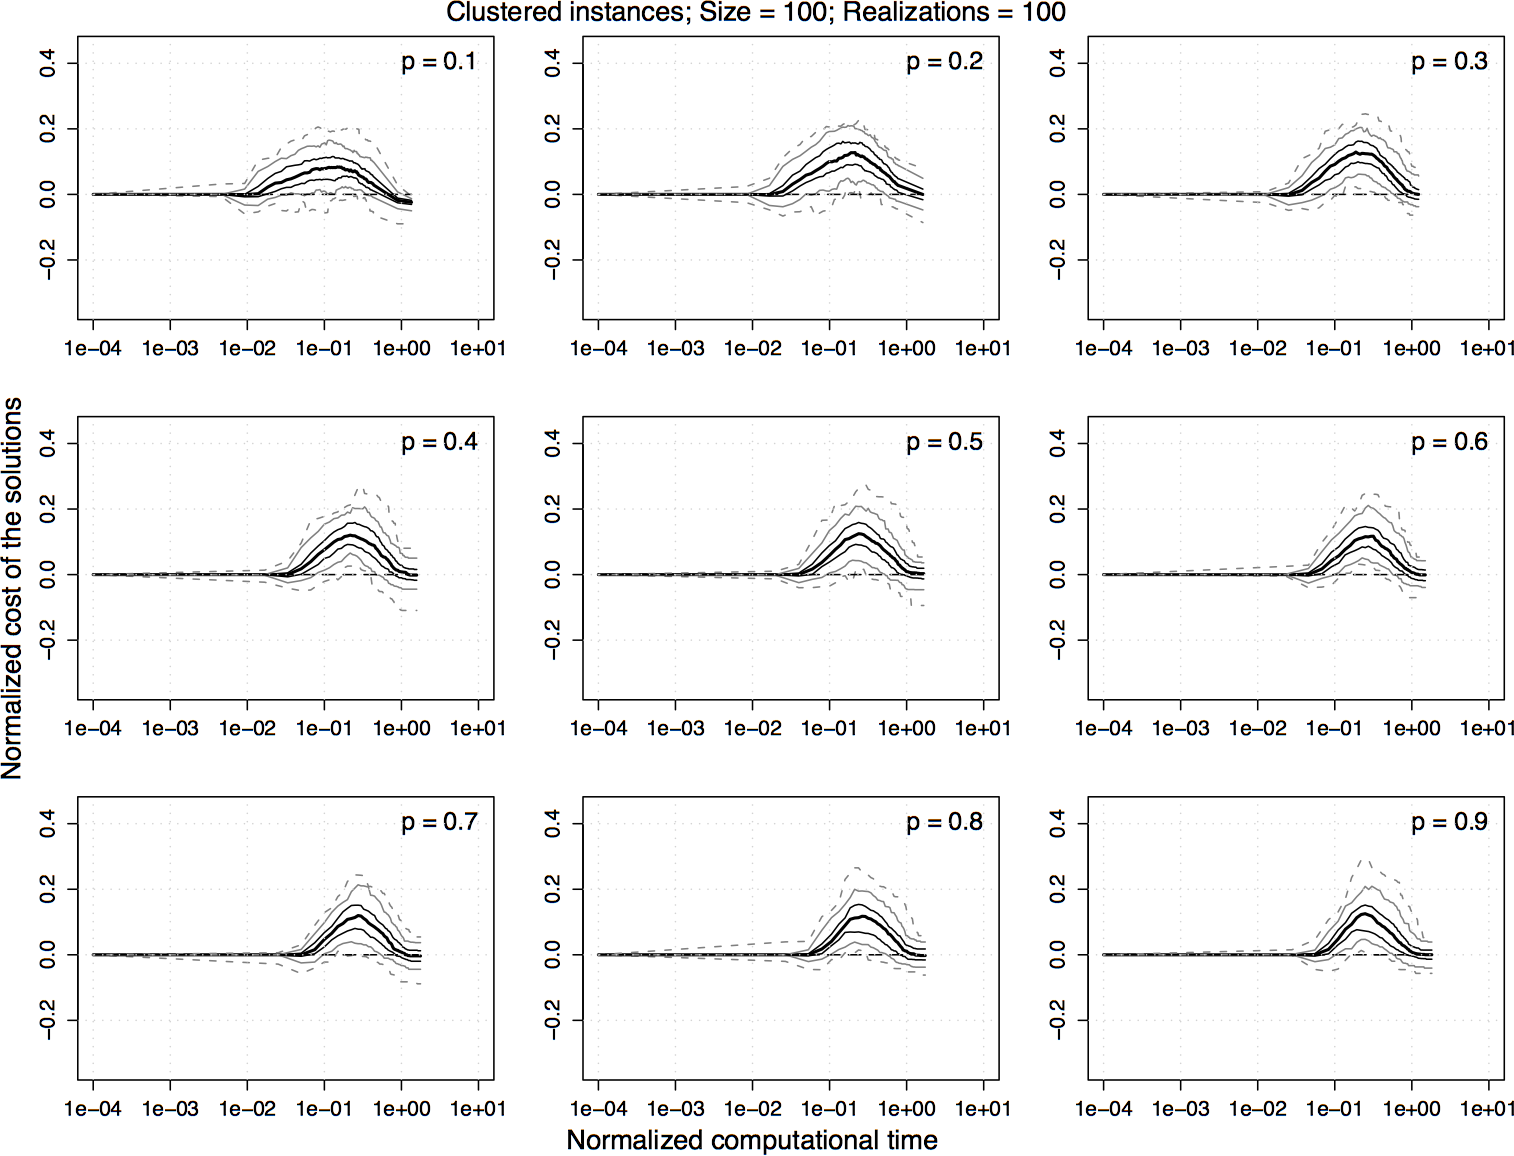
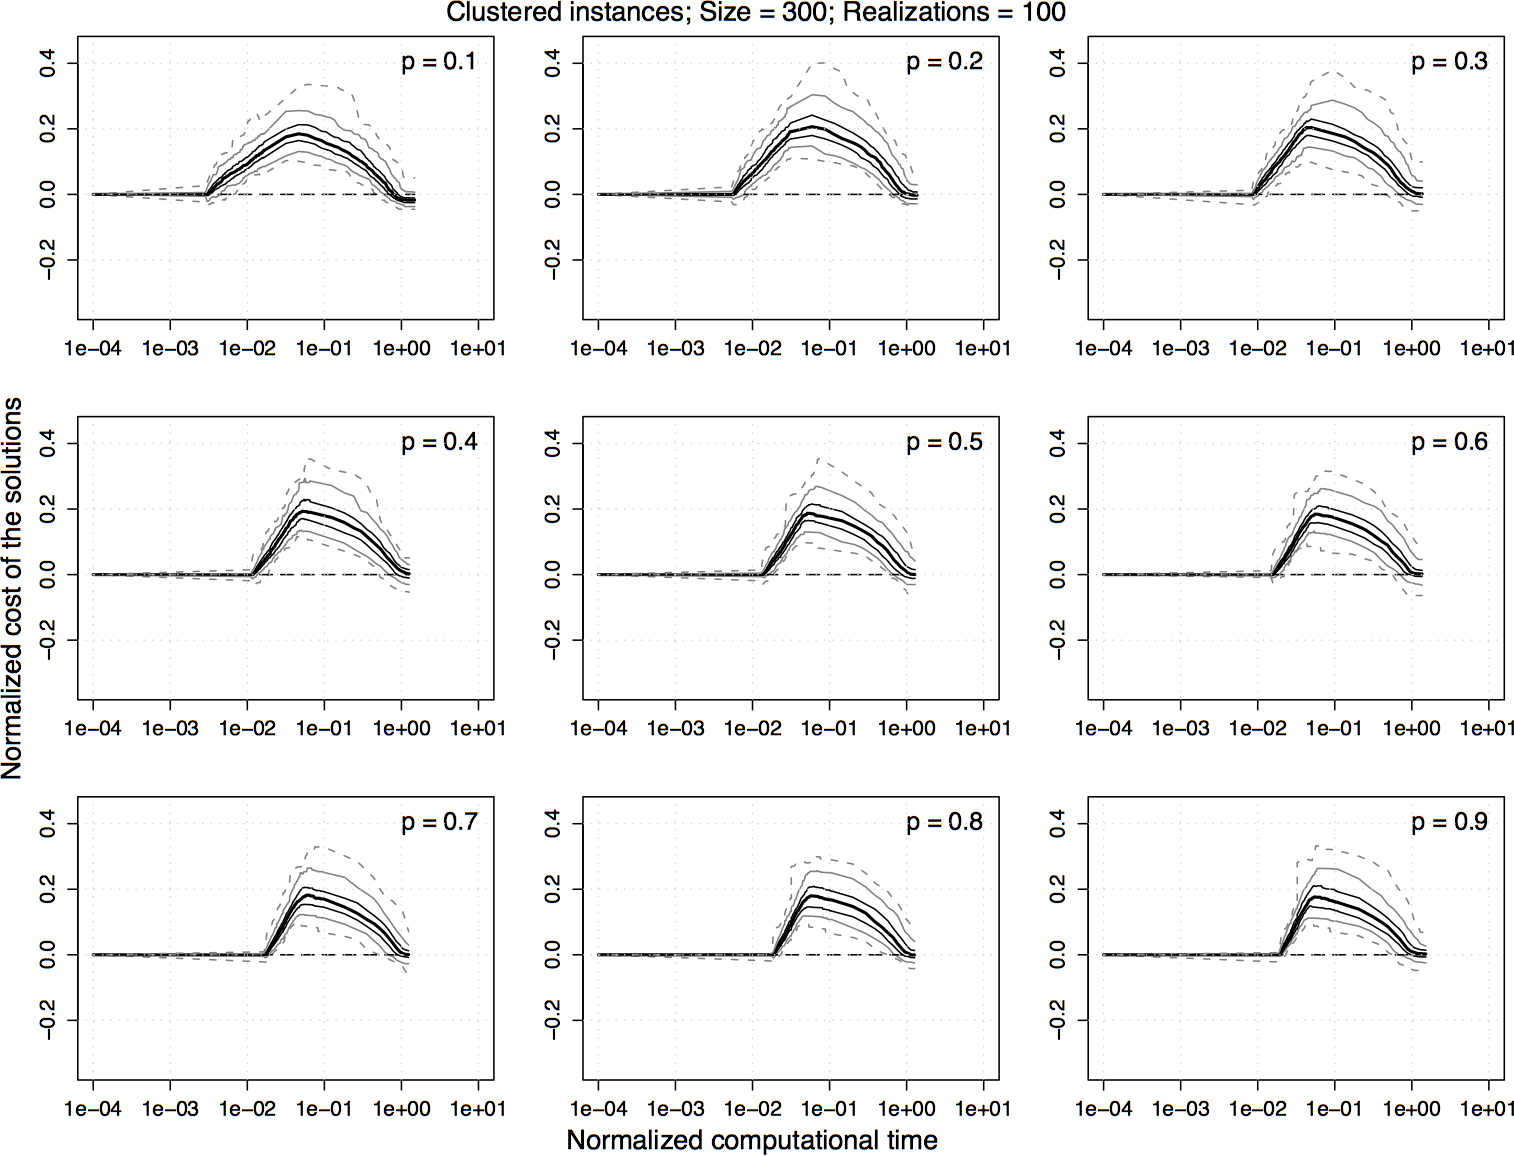
Experimental results on clustered homogeneous PTSP instances of size 300. For the normalized values shown in the previous plot, the difference between 2.5-opt-EEs-100 and 2.5-opt-ACs over time is computed and the 5%, 25%, 50%, 75%, and 95% quantiles of the distribution of the differences are plotted. For a curve, a value greater than zero indicates that 2.5-opt-EEs-100 is better than 2.5-opt-ACs and vice versa.
 |
 |
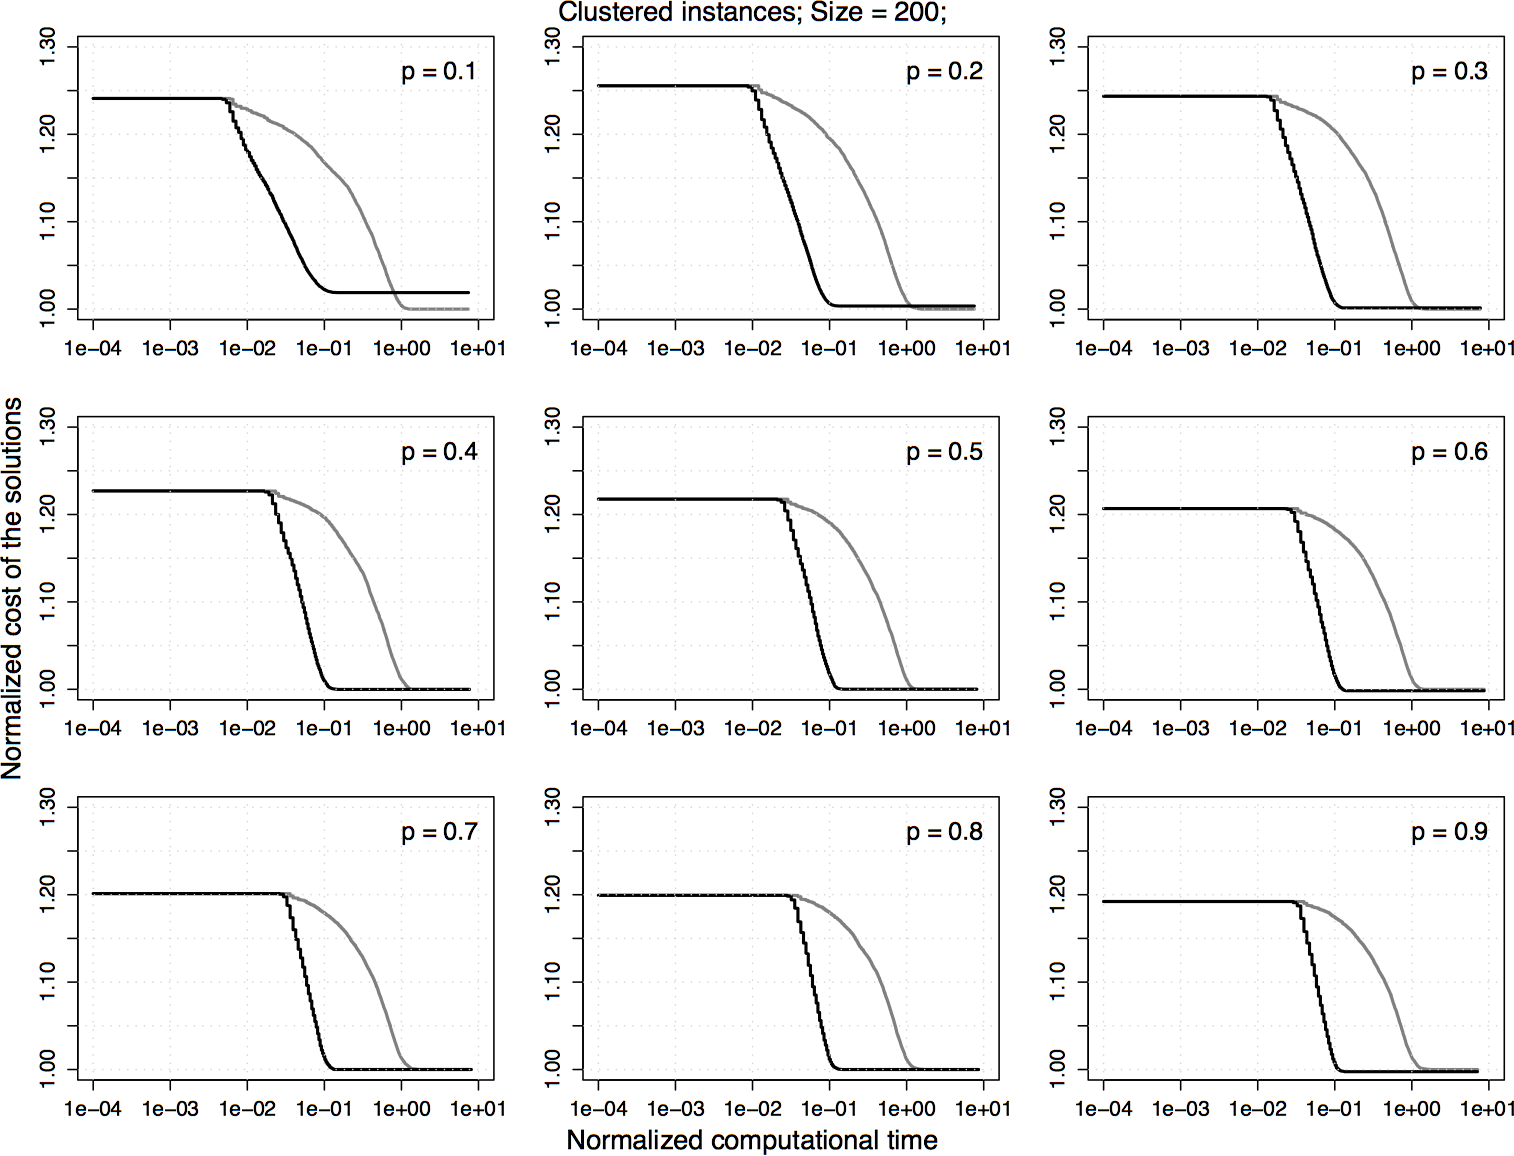
Experimental results on clustered homogeneous PTSP instances of size 200. The plots represent the average cost of the solutions obtained by 2.5-opt-EEs-100 normalized by the one obtained by 2.5-opt-ACs. Each algorithm is stopped when it reaches a local optimum.
 |
|
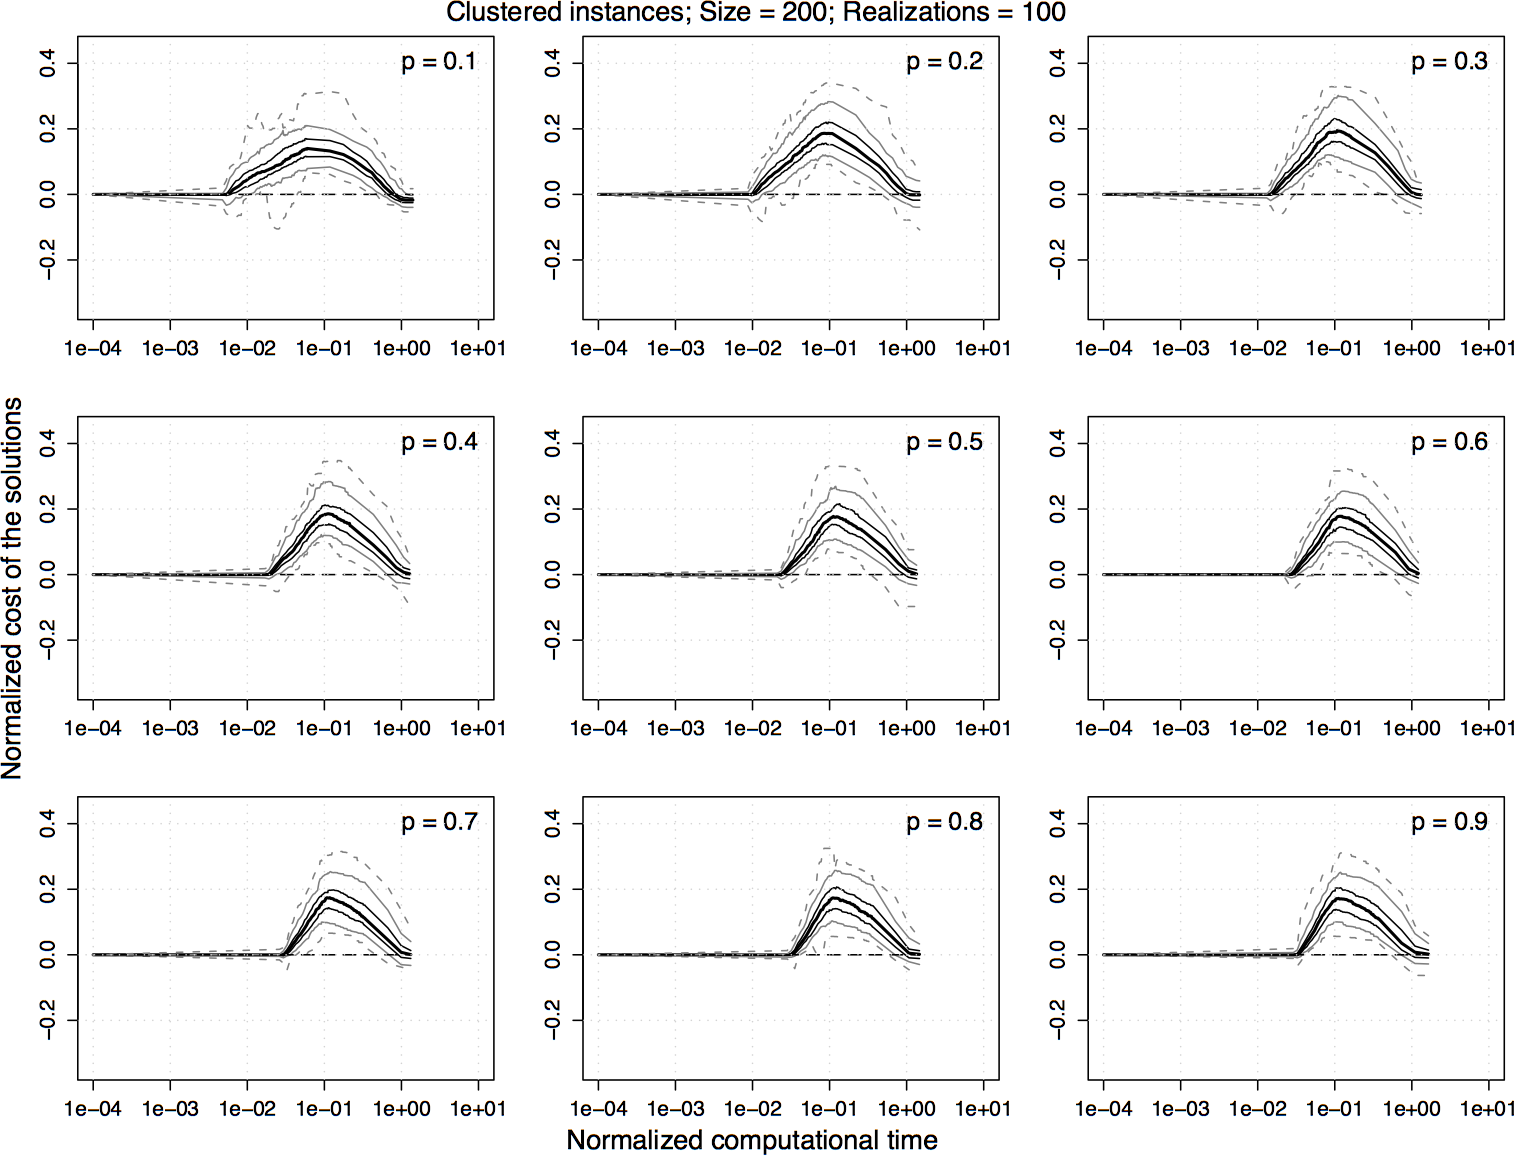
Experimental results on clustered homogeneous PTSP instances of size 200. For the normalized values shown in the previous plot, the difference between 2.5-opt-EEs-100 and 2.5-opt-ACs over time is computed and the 5%, 25%, 50%, 75%, and 95% quantiles of the distribution of the differences are plotted. For a curve, a value greater than zero indicates that 2.5-opt-EEs-100 is better than 2.5-opt-ACs and vice versa.
 |
|
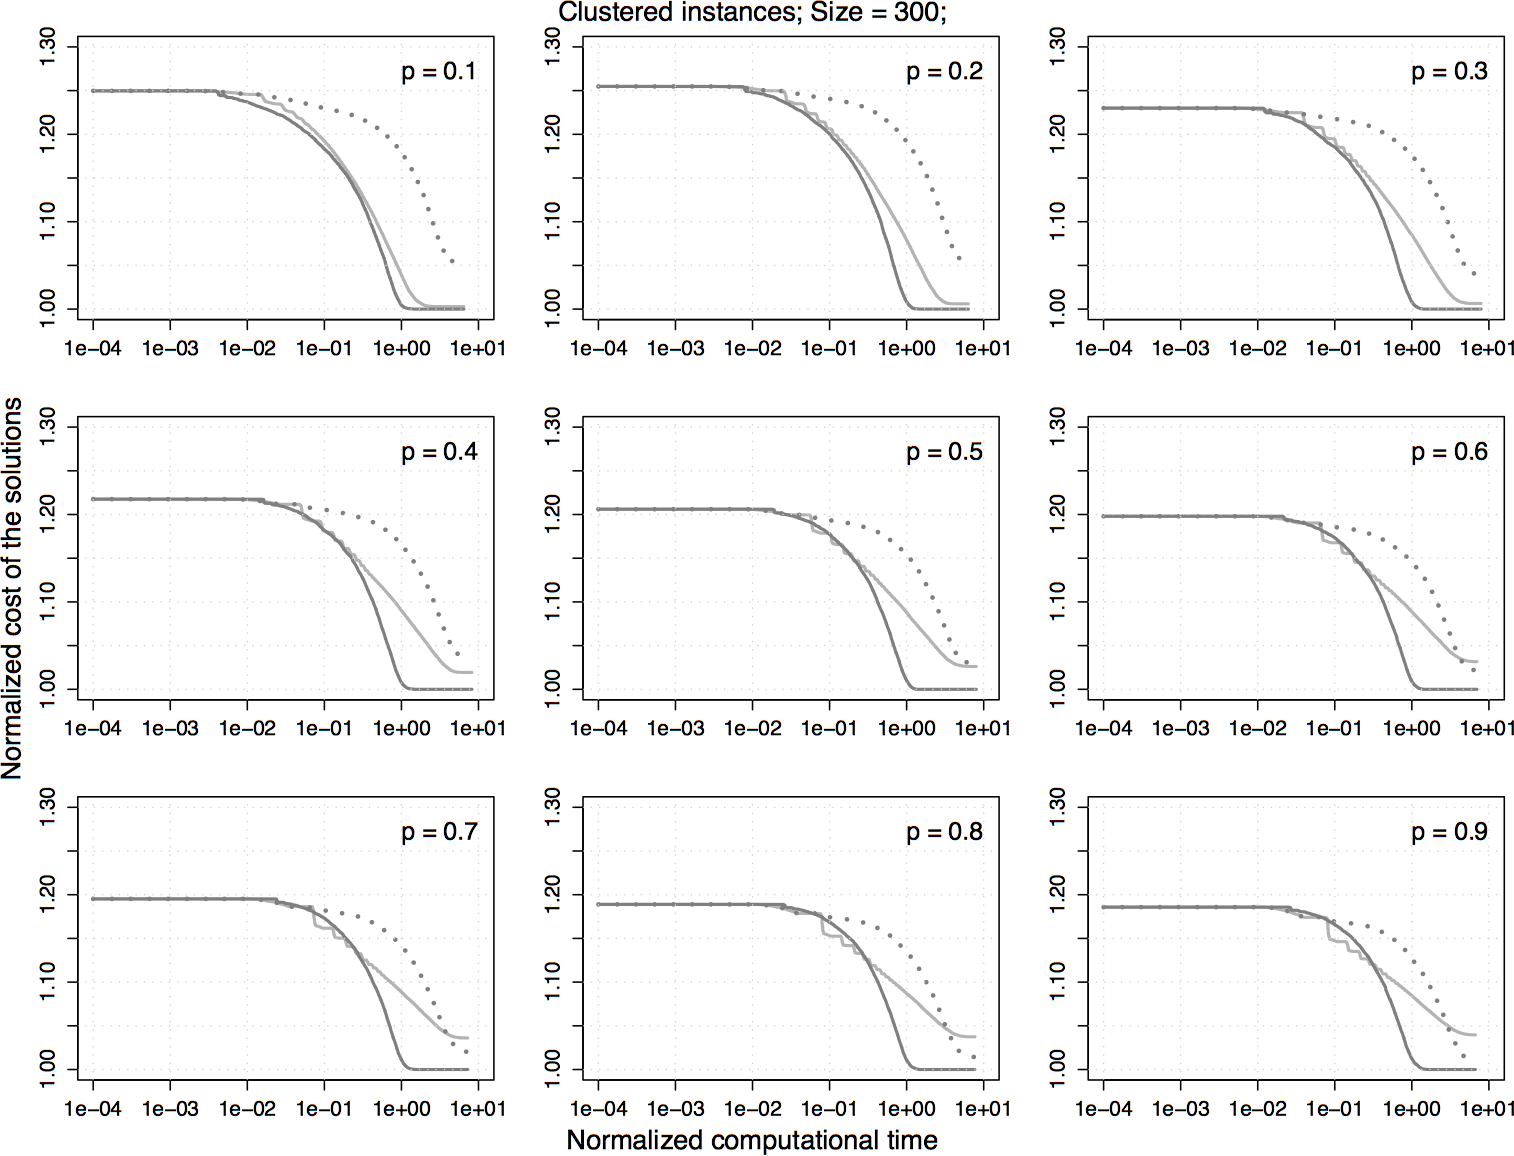
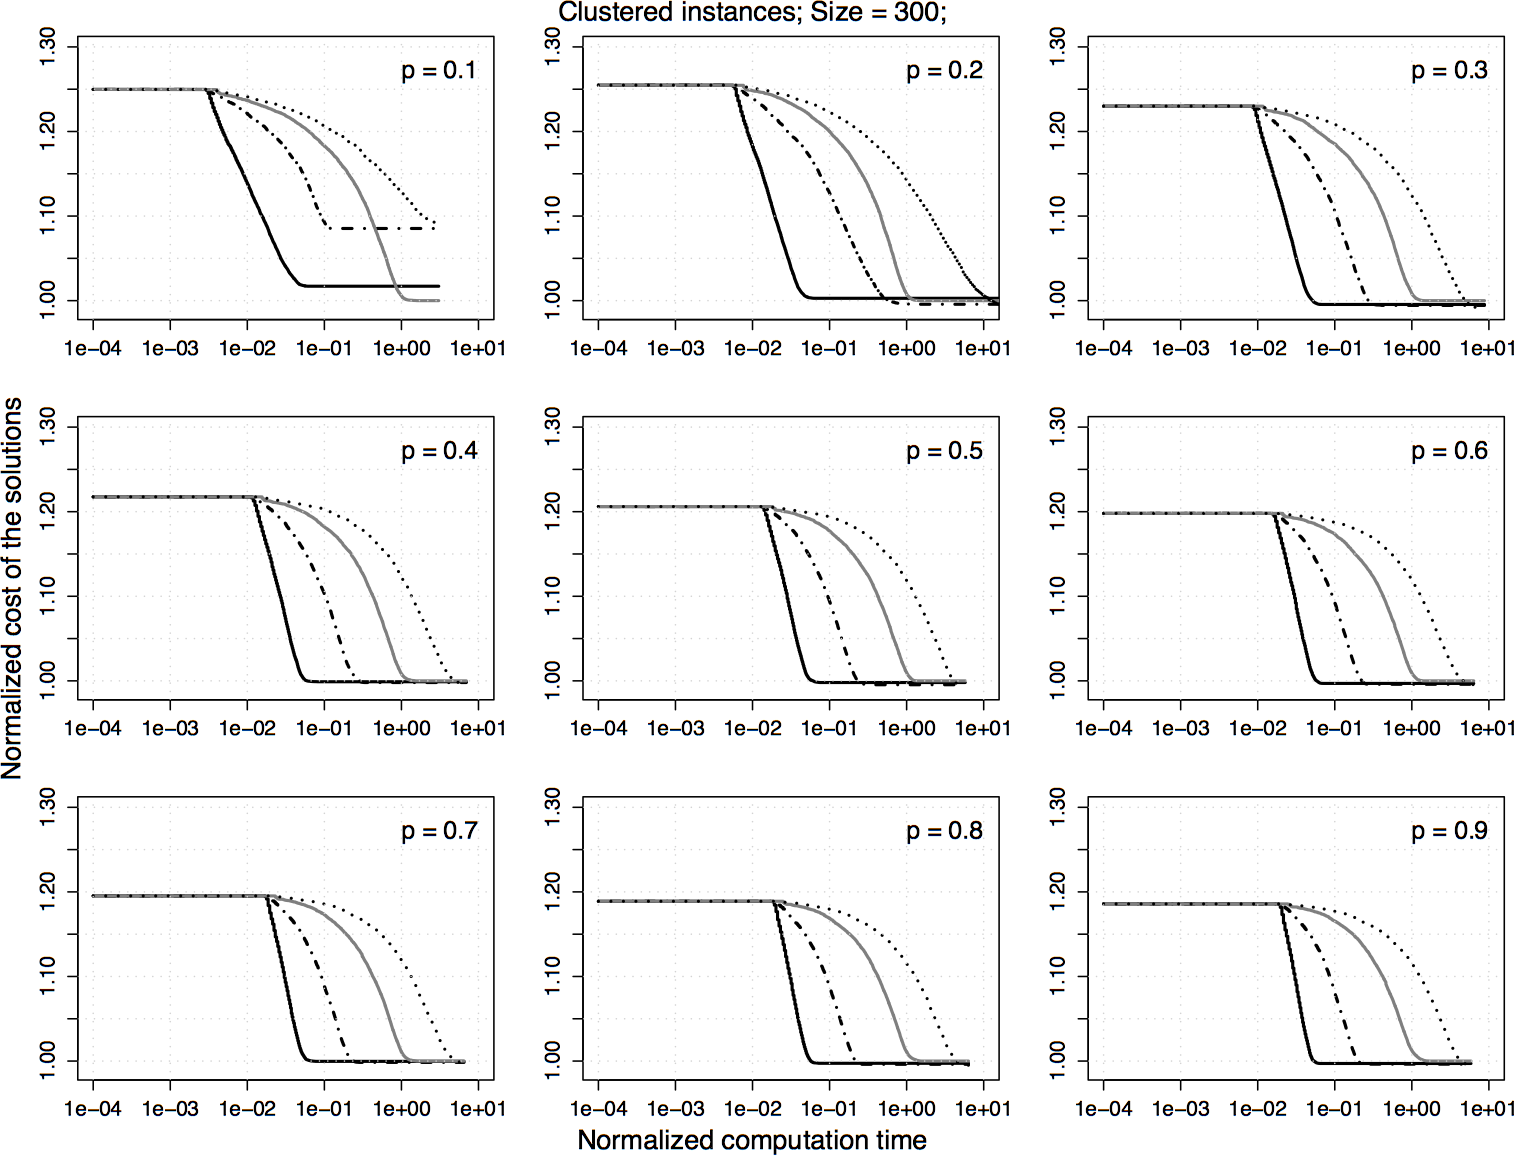
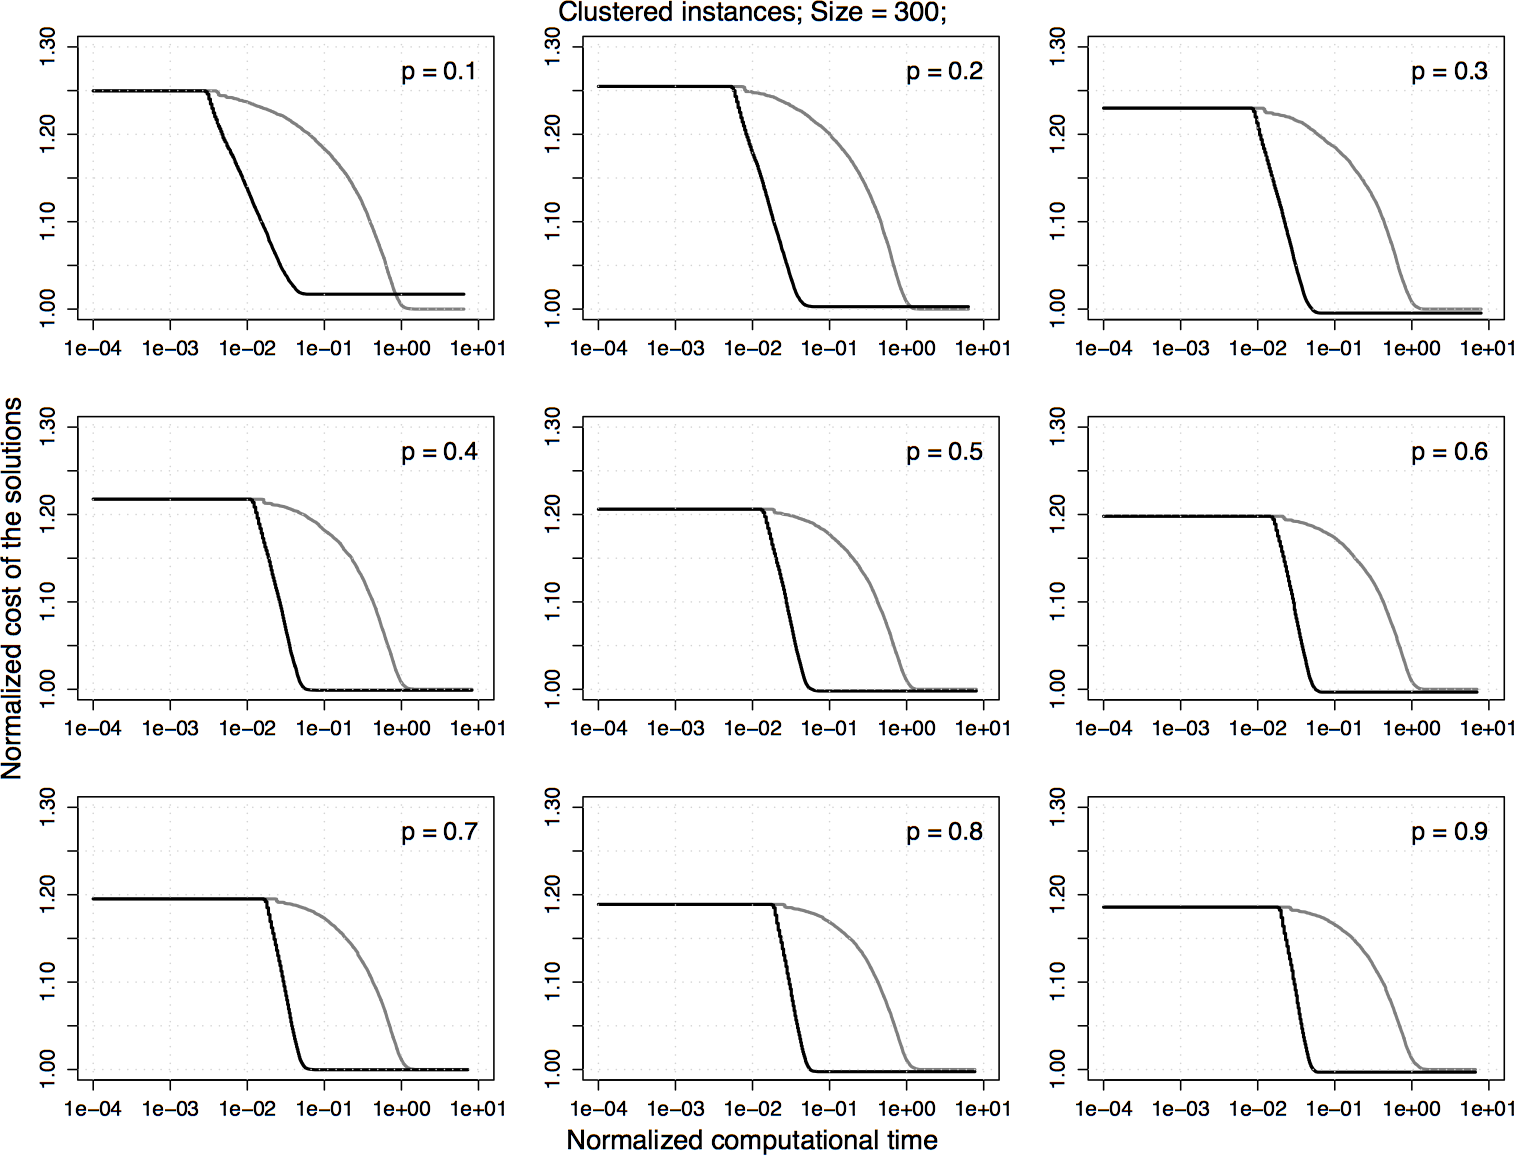
Experimental results on clustered homogeneous PTSP instances of size 300. The plots represent the average cost of the solutions obtained by 2.5-opt-EEs-100 normalized by the one obtained by 2.5-opt-ACs. Each algorithm is stopped when it reaches a local optimum.
 |
|
Experimental results on clustered homogeneous PTSP instances of size 300. For the normalized values shown in the previous plot, the difference between 2.5-opt-EEs-100 and 2.5-opt-ACs over time is computed and the 5%, 25%, 50%, 75%, and 95% quantiles of the distribution of the differences are plotted. For a curve, a value greater than zero indicates that 2.5-opt-EEs-100 is better than 2.5-opt-ACs and vice versa.
 |
|
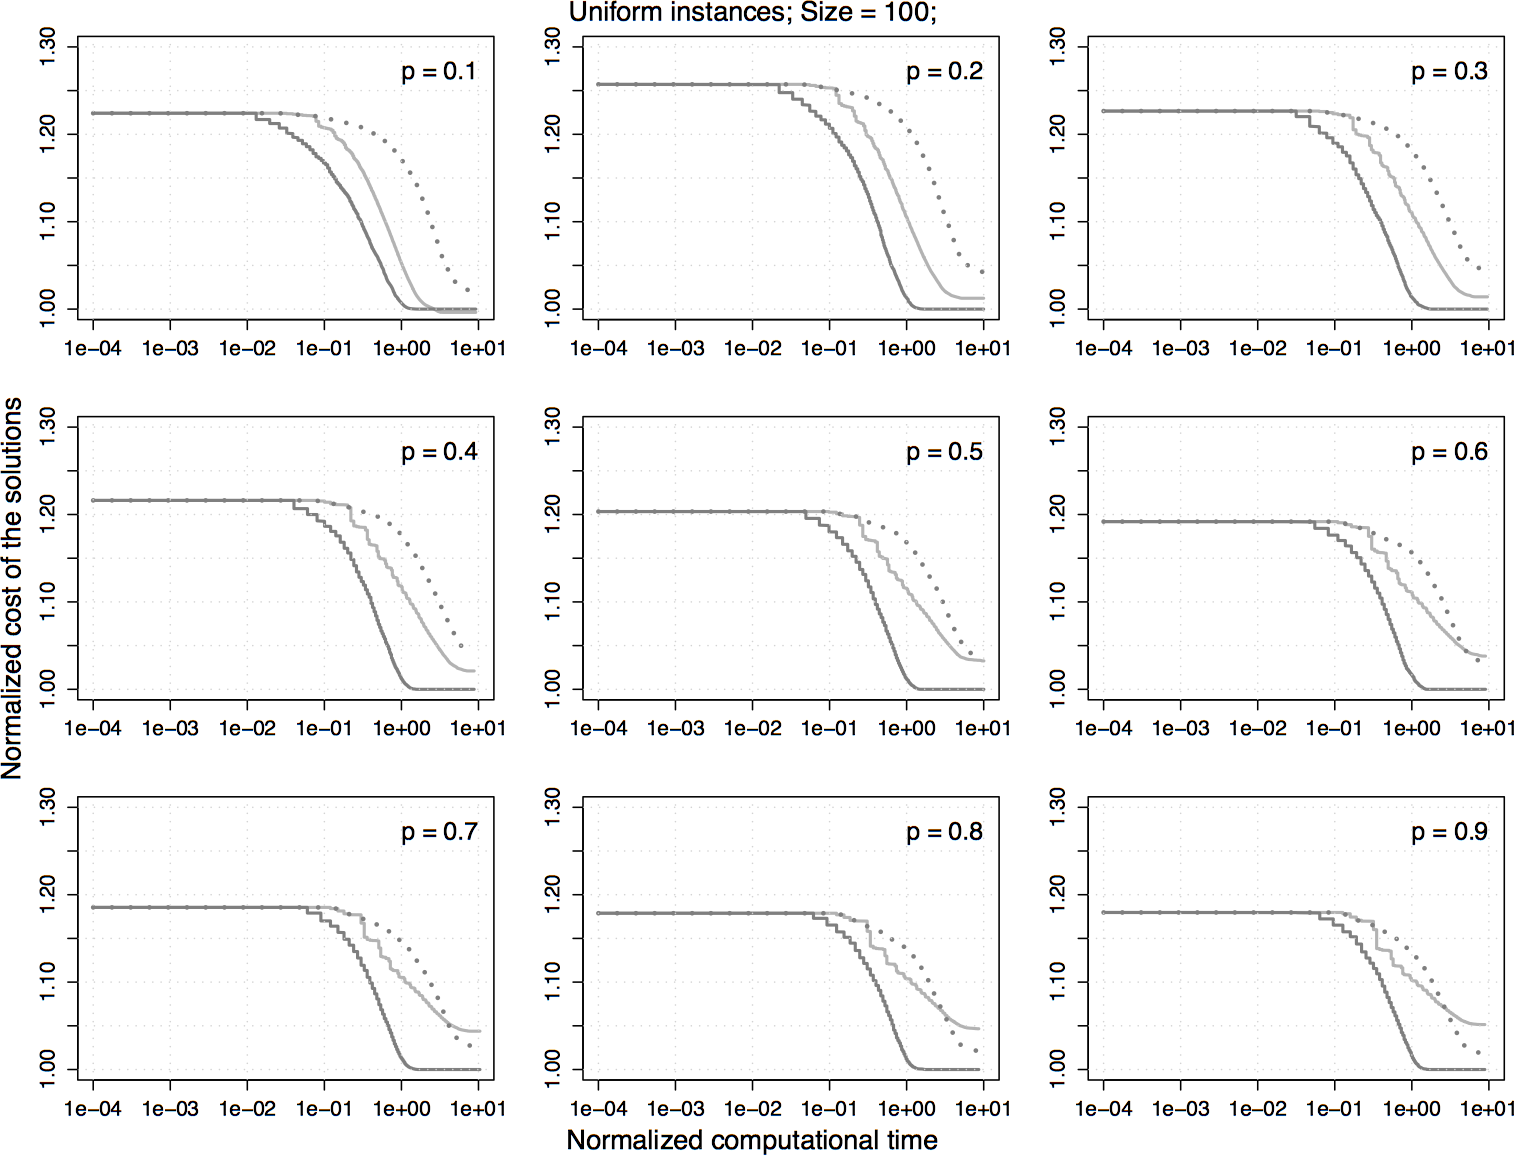
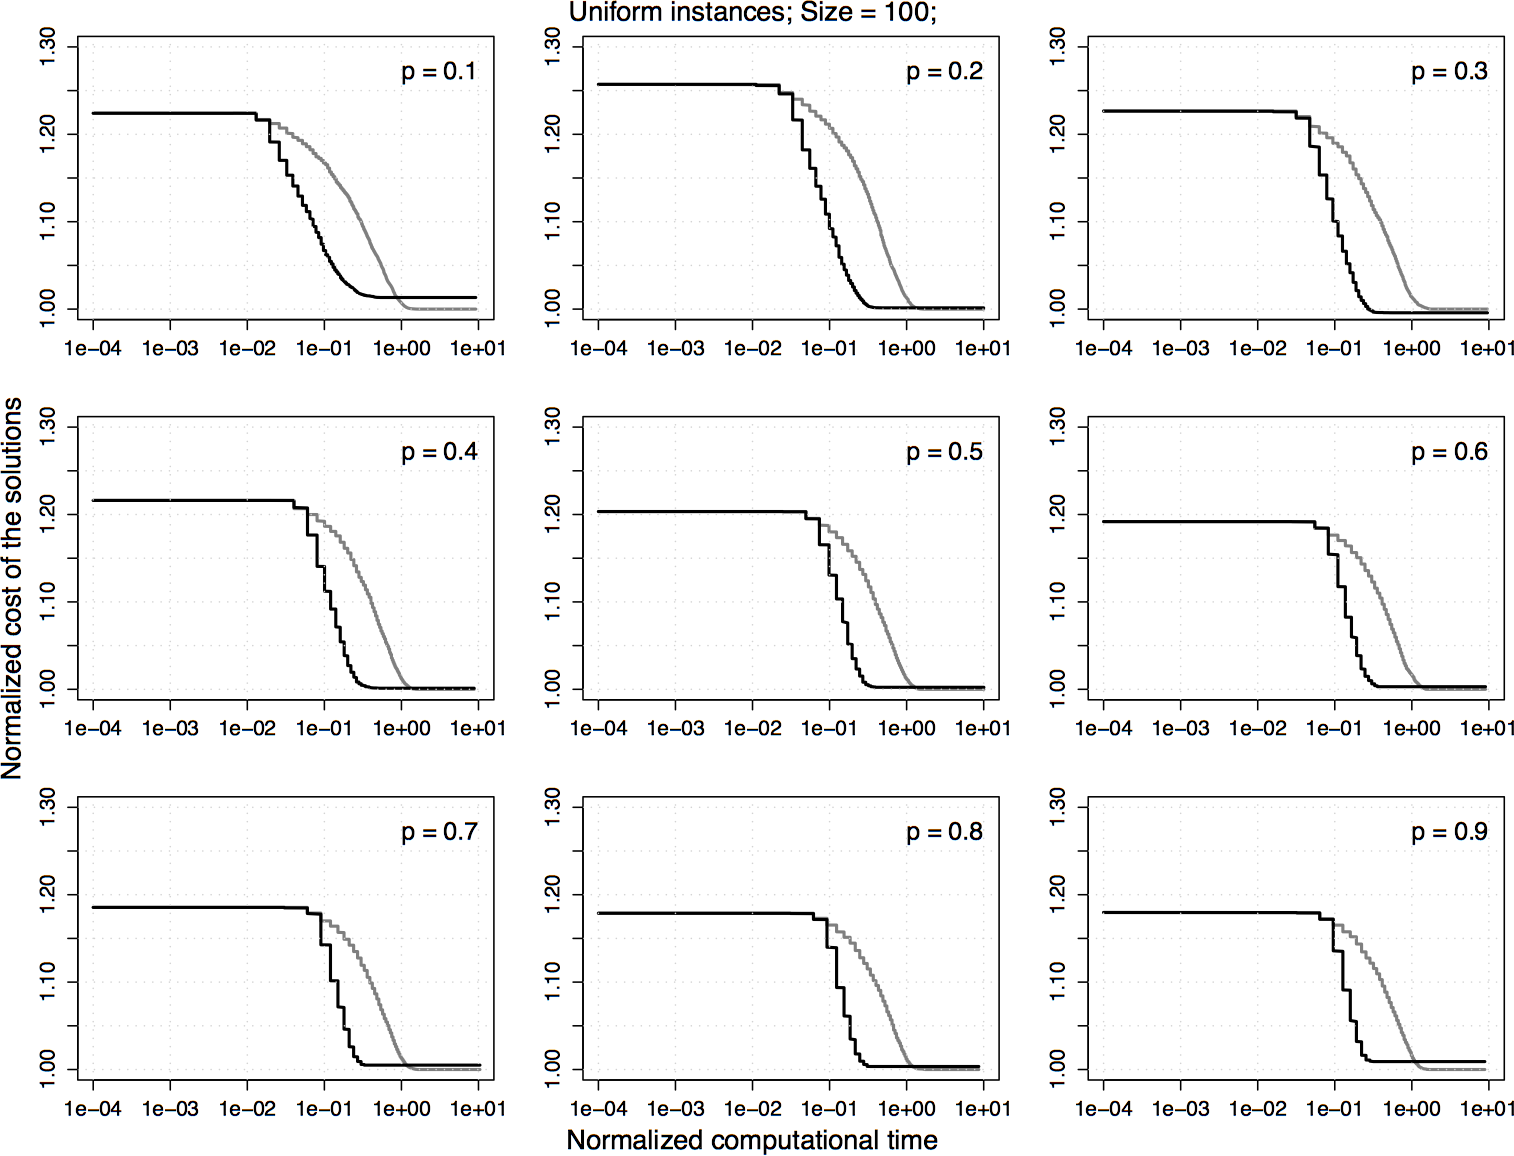
Experimental results on uniform homogeneous PTSP instances of size 100. The plots represent the average cost of the solutions obtained by 2.5-opt-EEs-100 normalized by the one obtained by 2.5-opt-ACs. Each algorithm is stopped when it reaches a local optimum.
 |
|
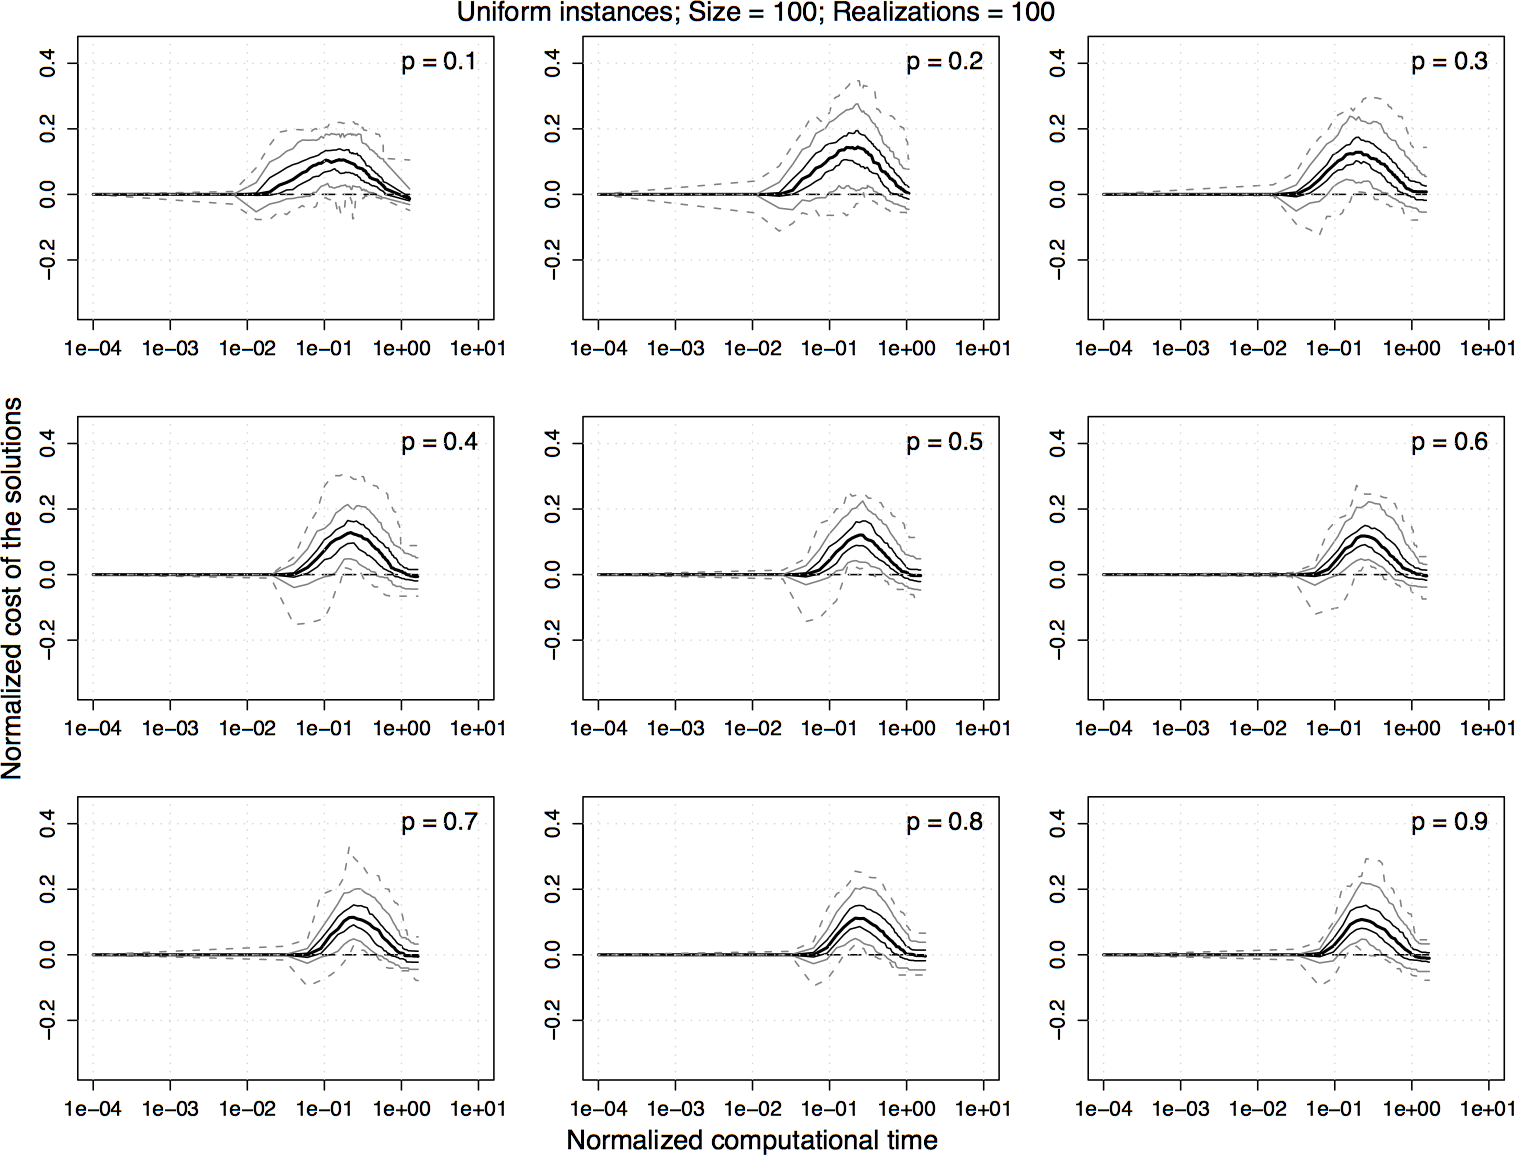
Experimental results on uniform homogeneous PTSP instances of size 300. For the normalized values shown in the previous plot, the difference between 2.5-opt-EEs-100 and 2.5-opt-ACs over time is computed and the 5%, 25%, 50%, 75%, and 95% quantiles of the distribution of the differences are plotted. For a curve, a value greater than zero indicates that 2.5-opt-EEs-100 is better than 2.5-opt-ACs and vice versa.
 |
|
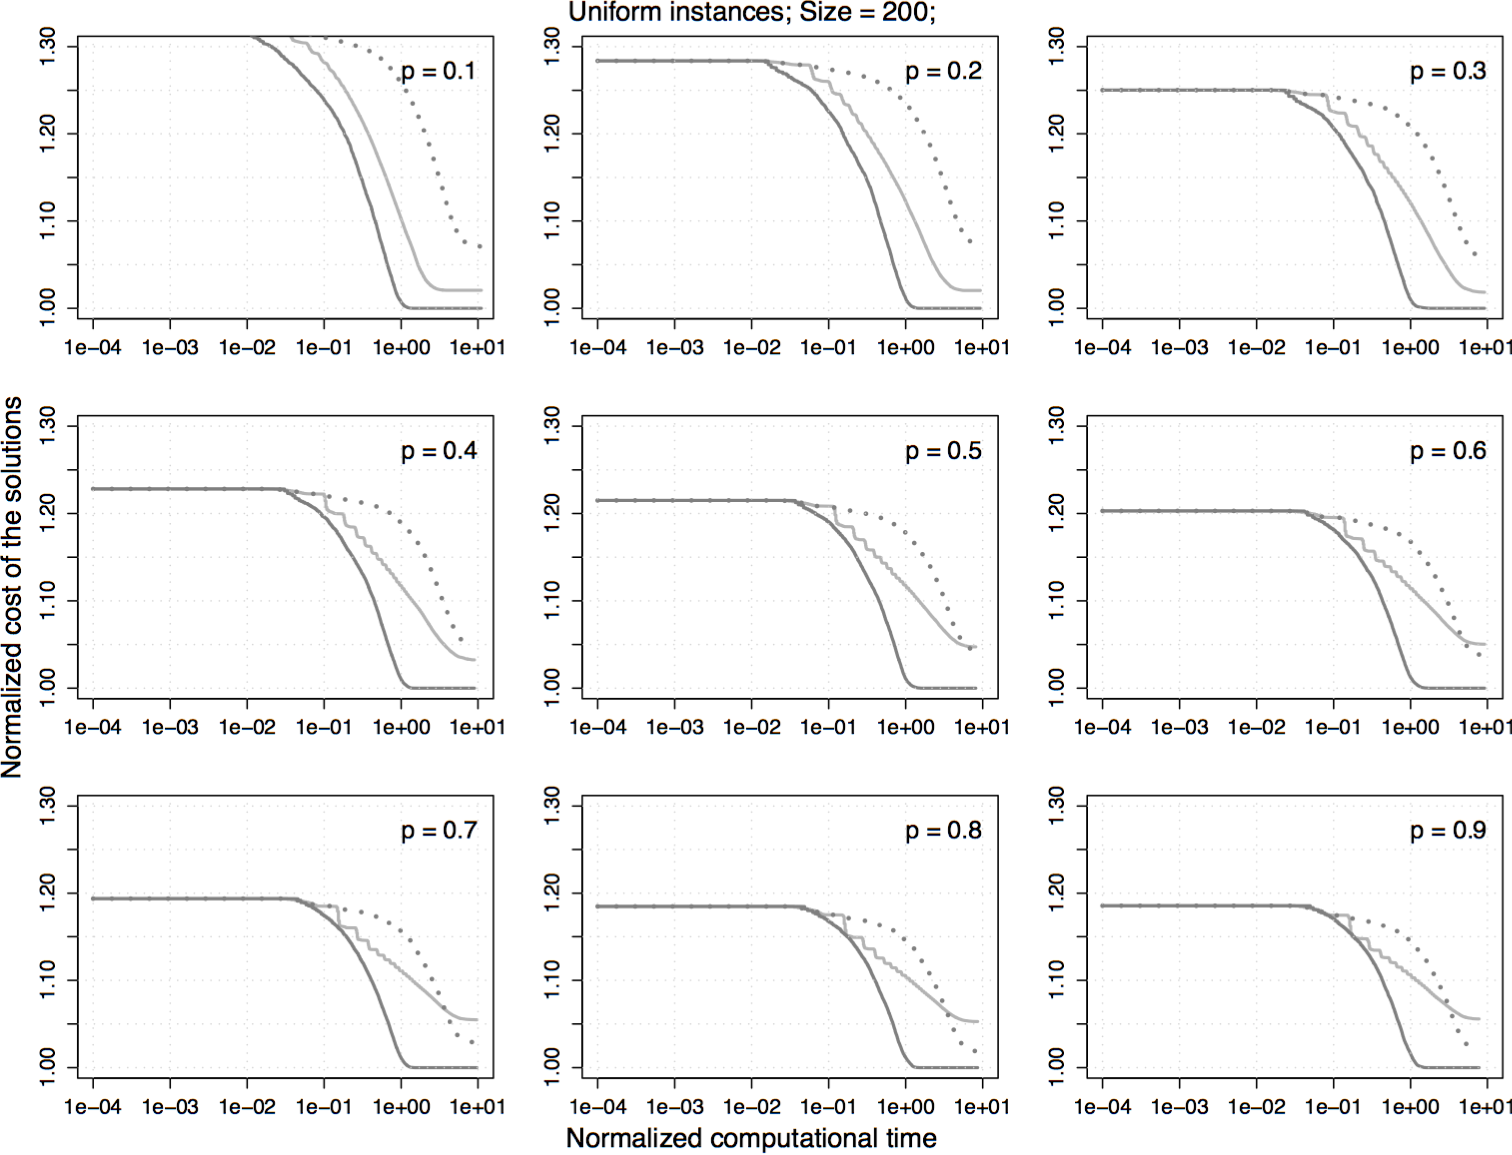
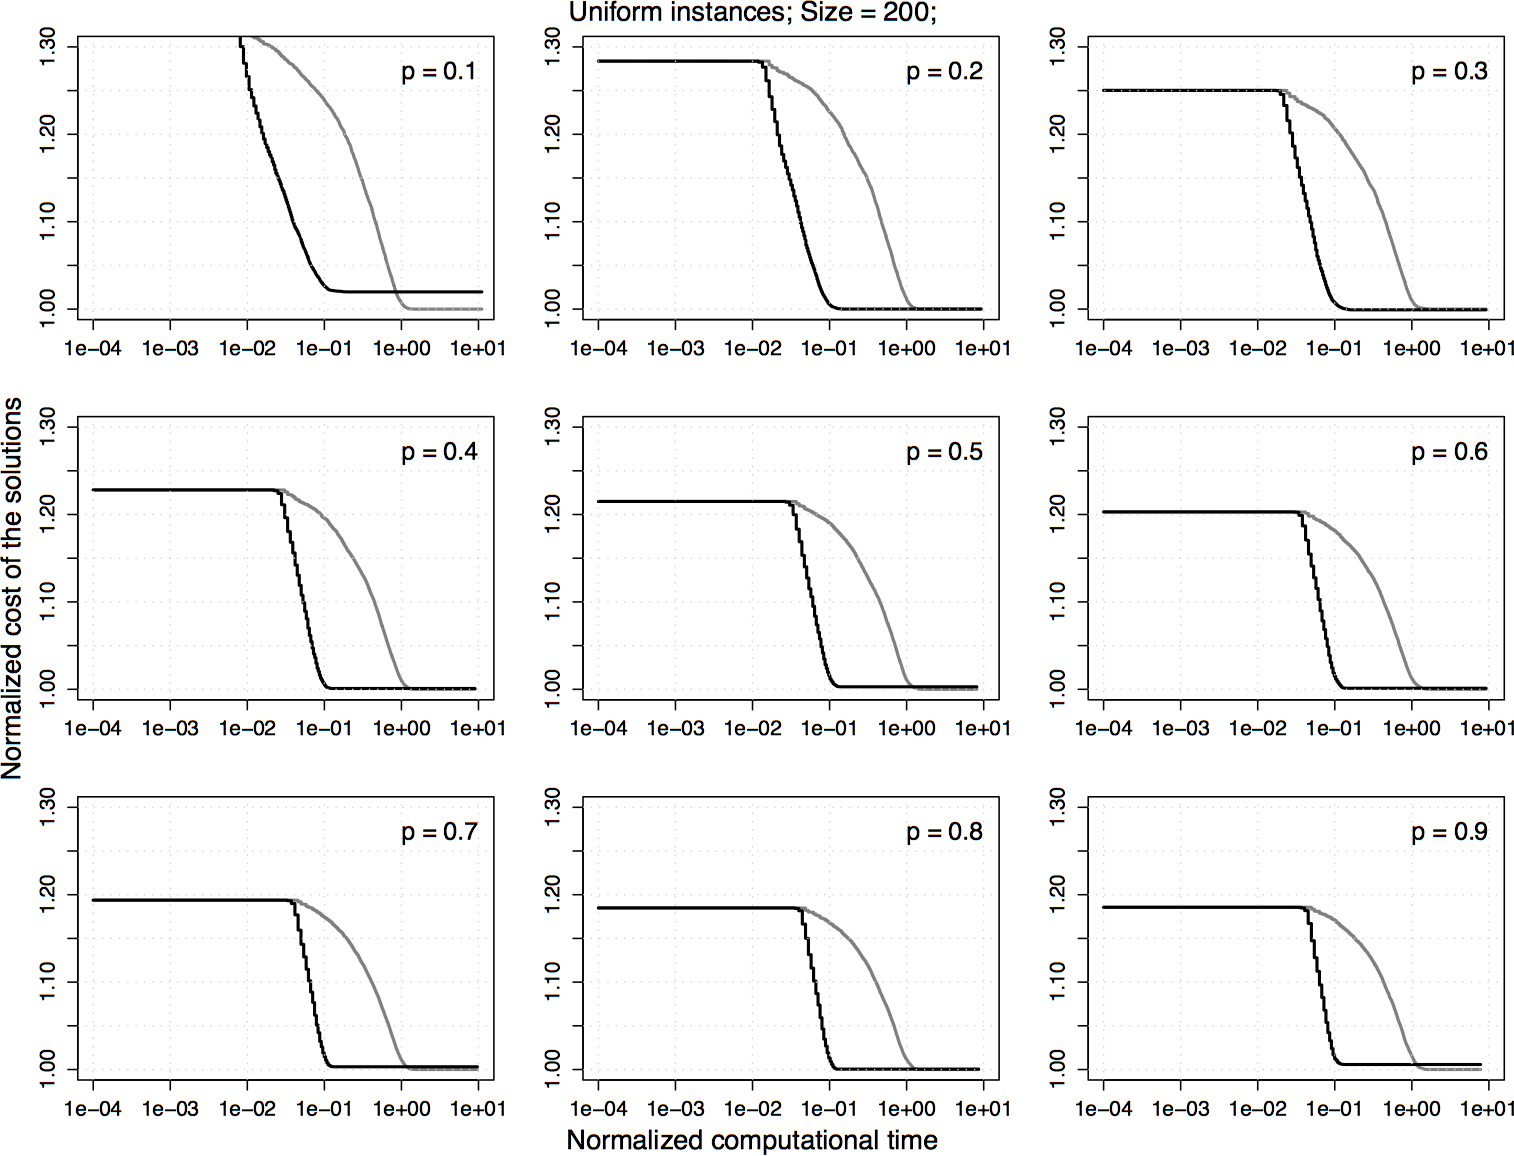
Experimental results on uniform homogeneous PTSP instances of size 200. The plots represent the average cost of the solutions obtained by 2.5-opt-EEs-100 normalized by the one obtained by 2.5-opt-ACs. Each algorithm is stopped when it reaches a local optimum.
 |
|
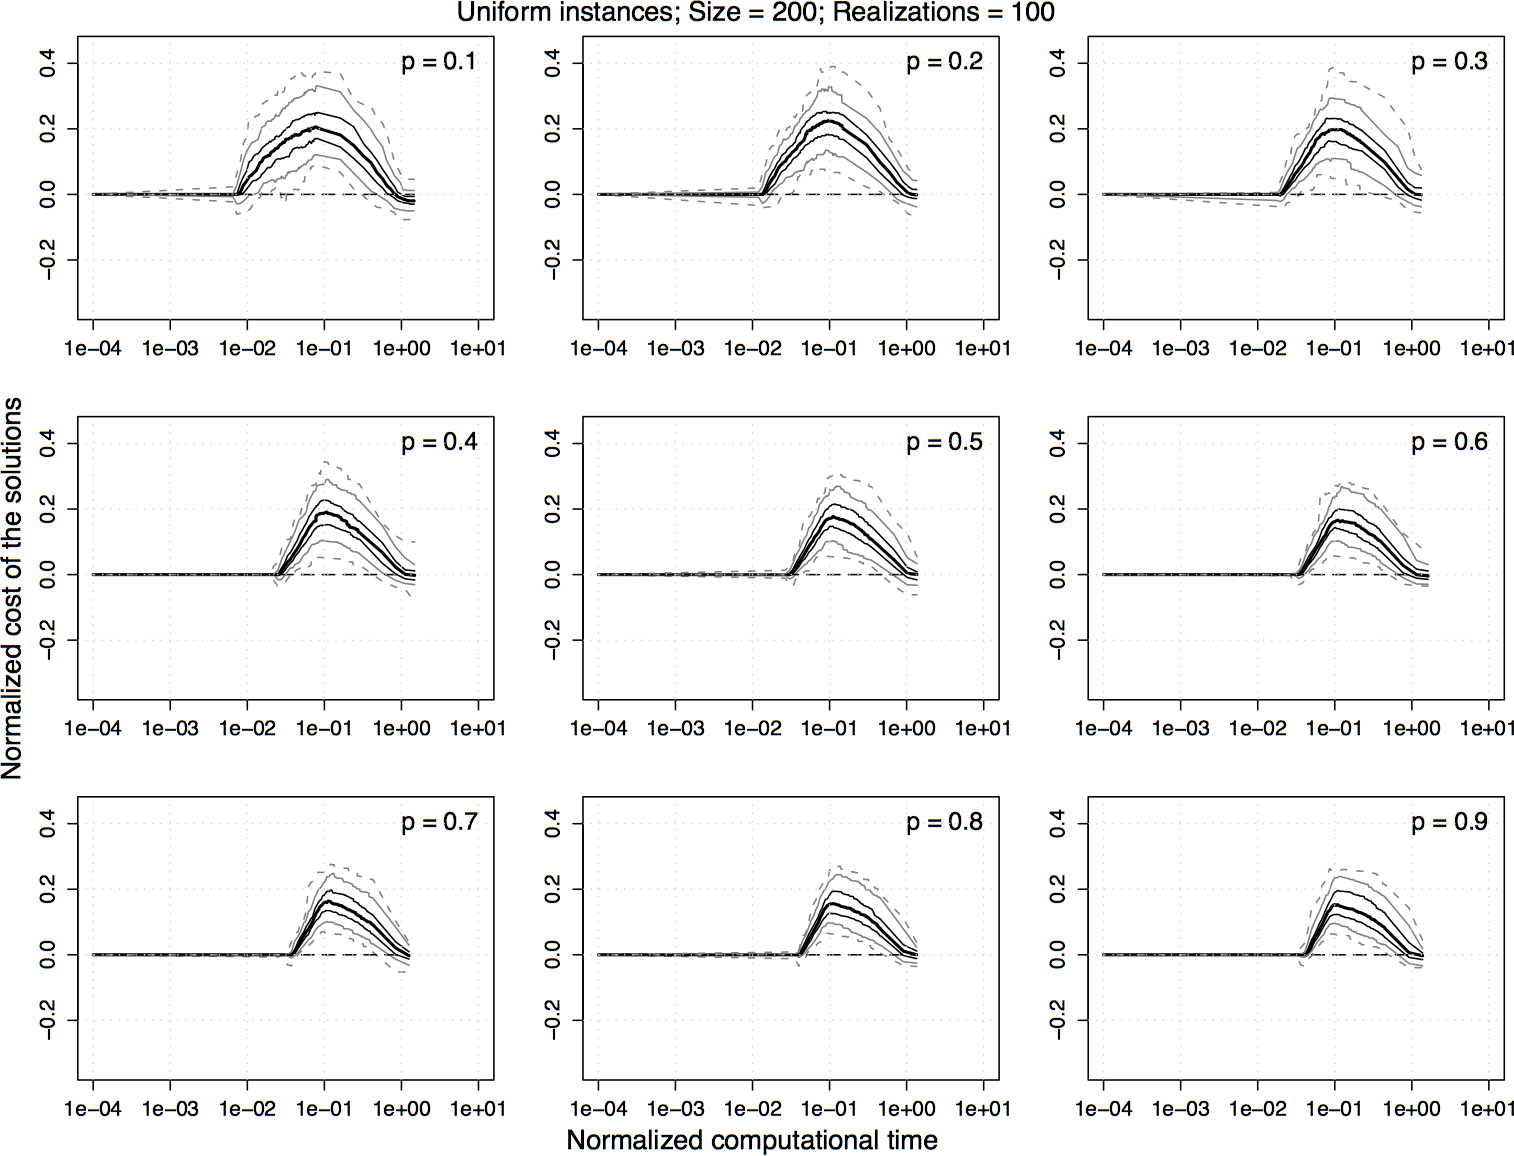
Experimental results on uniform homogeneous PTSP instances of size 200. For the normalized values shown in the previous plot, the difference between 2.5-opt-EEs-100 and 2.5-opt-ACs over time is computed and the 5%, 25%, 50%, 75%, and 95% quantiles of the distribution of the differences are plotted. For a curve, a value greater than zero indicates that 2.5-opt-EEs-100 is better than 2.5-opt-ACs and vice versa.
 |
|
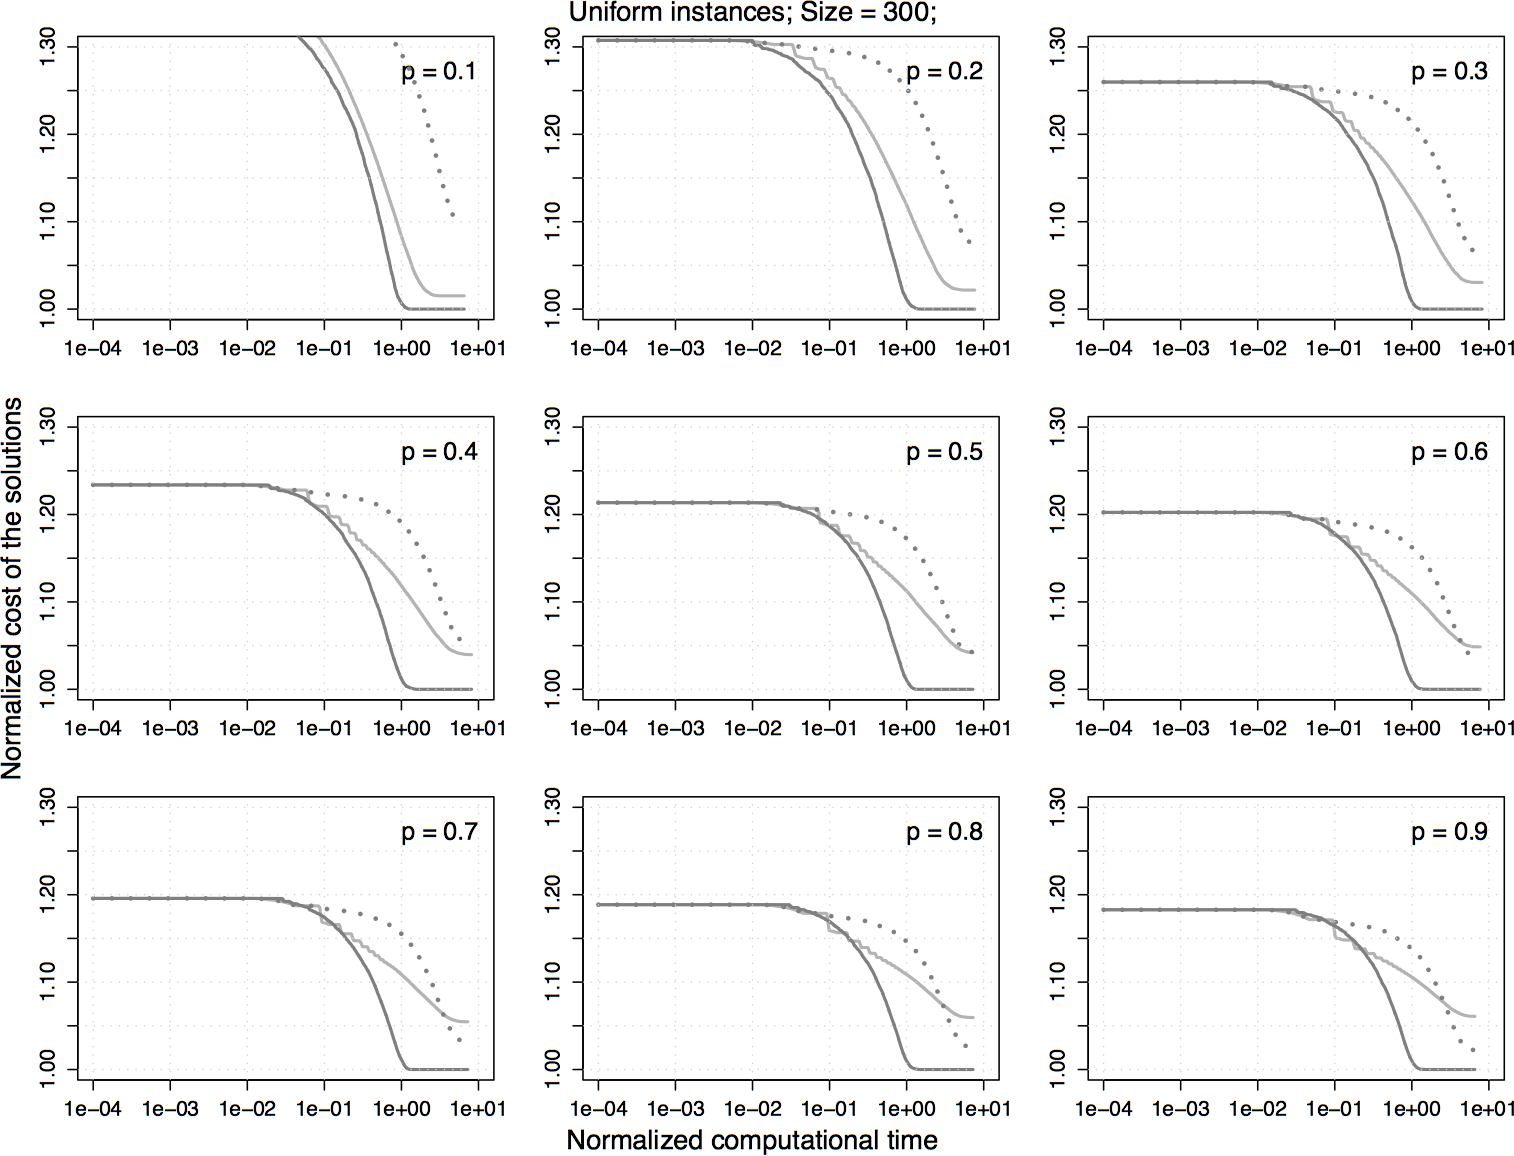
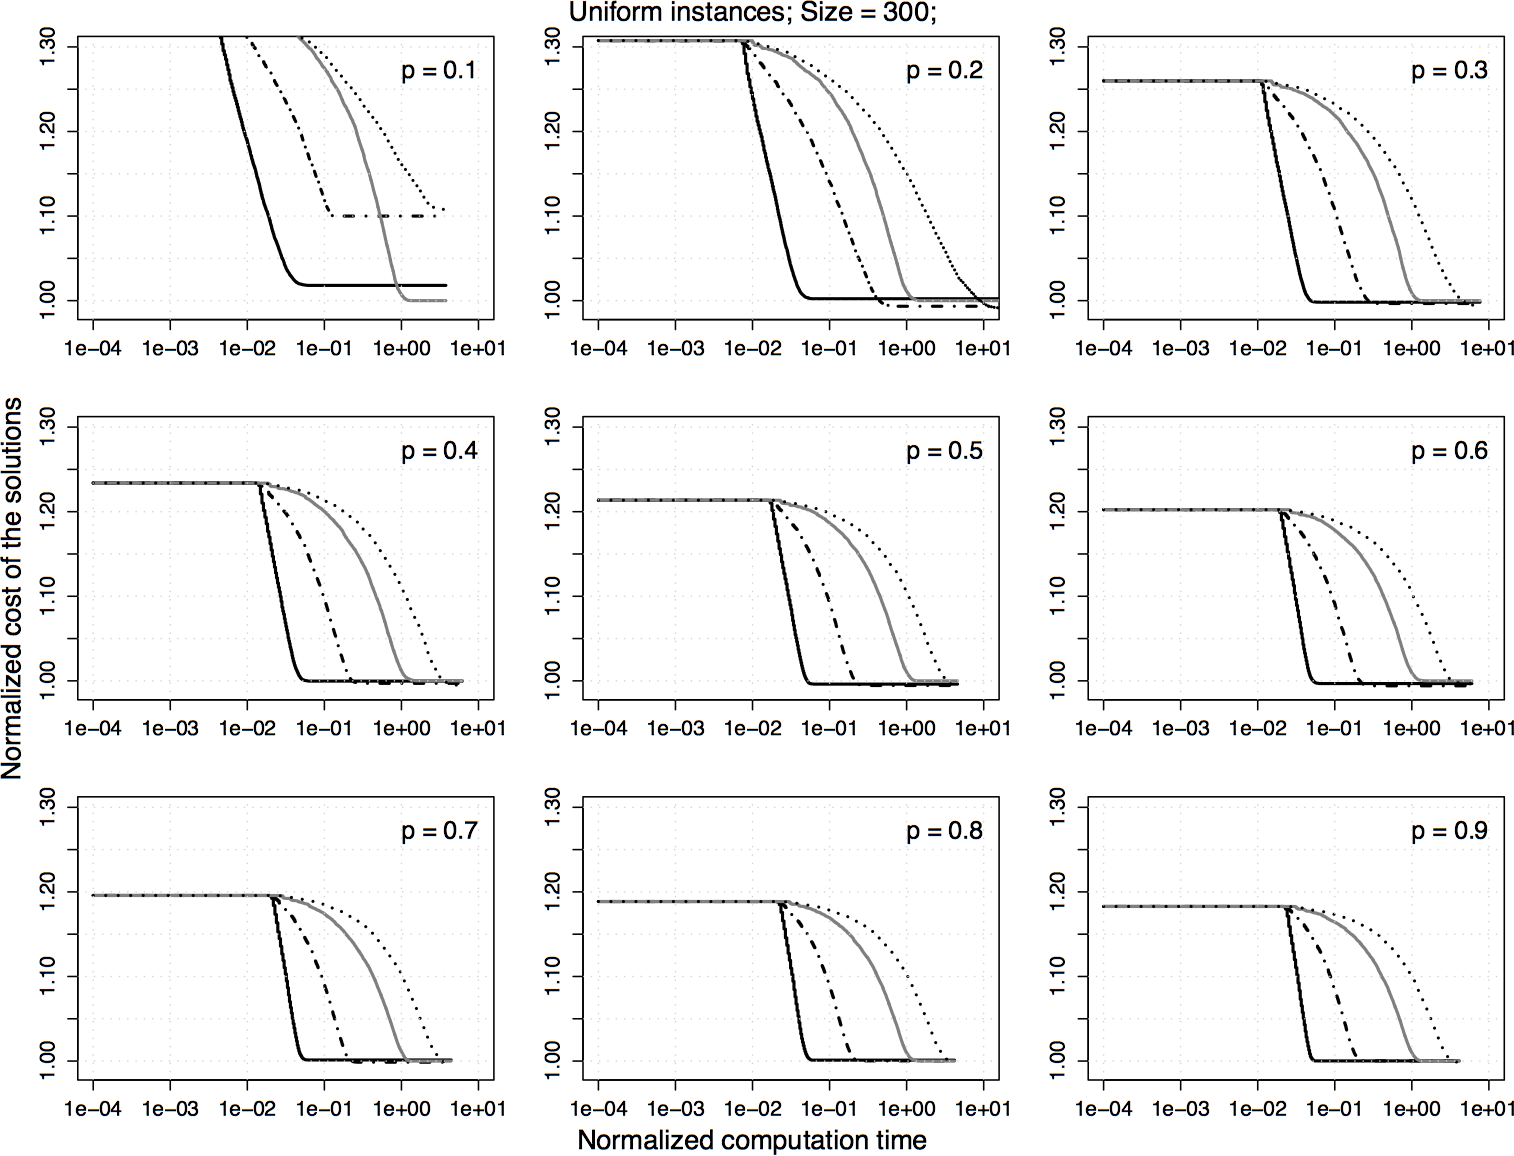
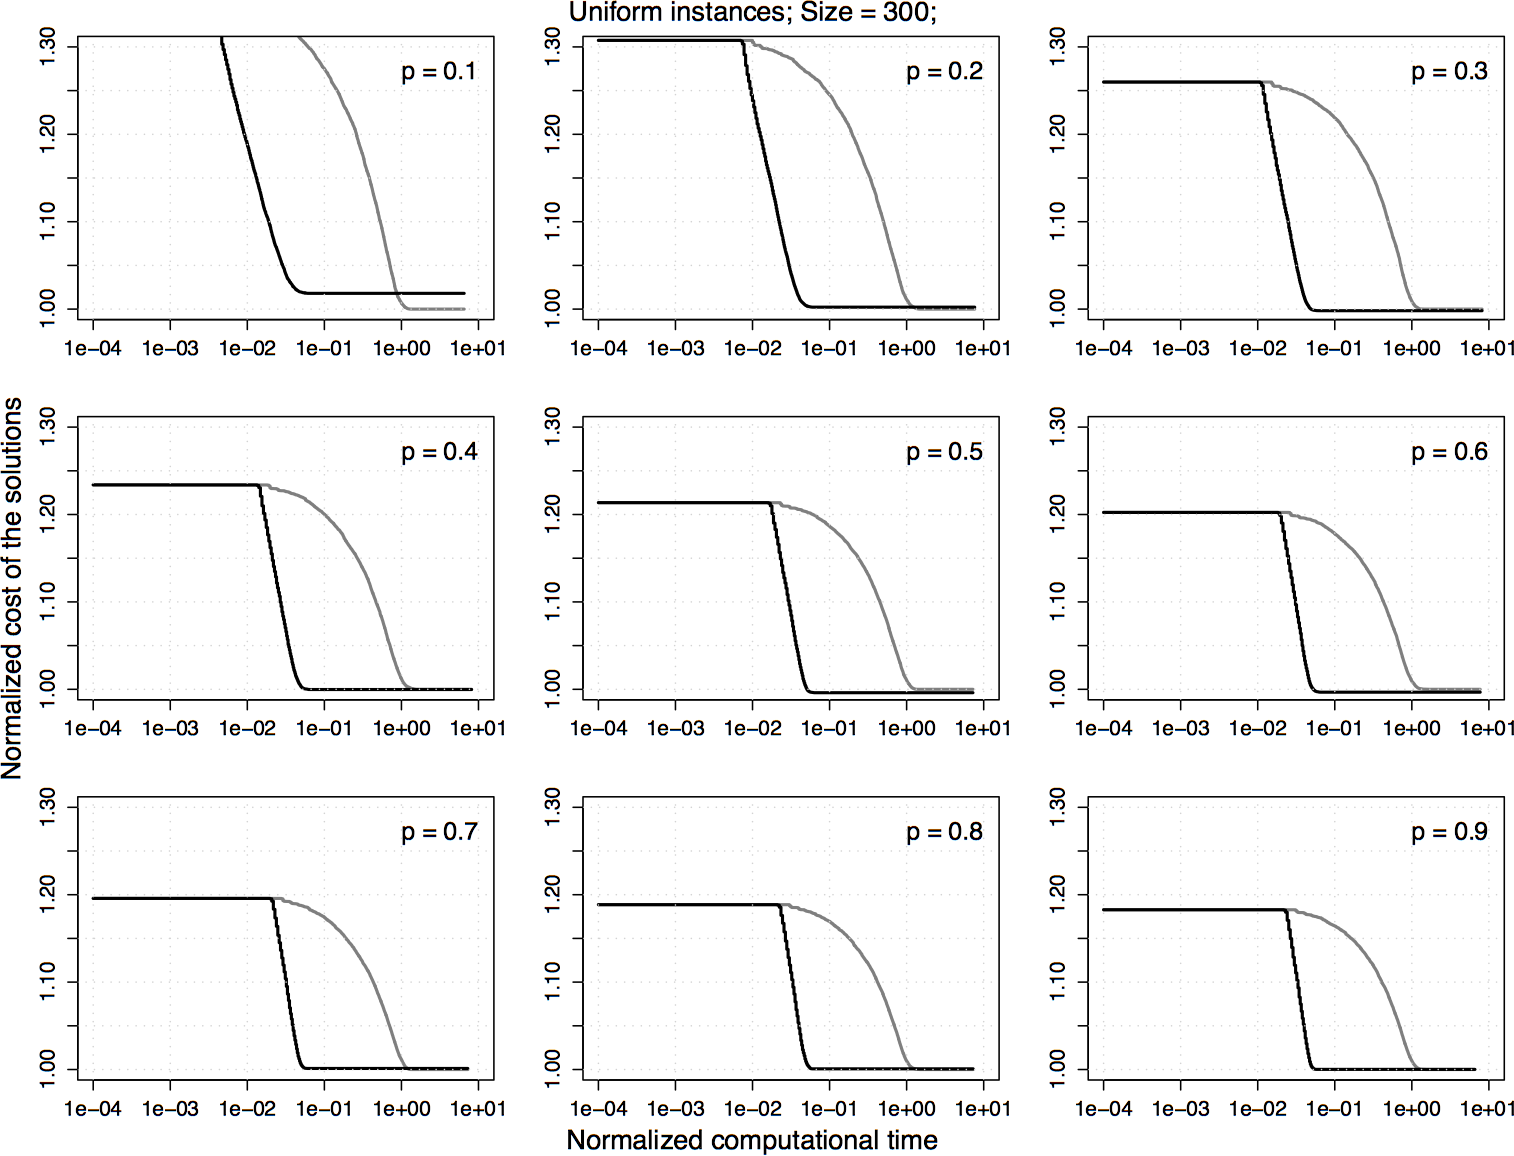
Experimental results on uniform homogeneous PTSP instances of size 300. The plots represent the average cost of the solutions obtained by 2.5-opt-EEs-100 normalized by the one obtained by 2.5-opt-ACs. Each algorithm is stopped when it reaches a local optimum.
 |
|
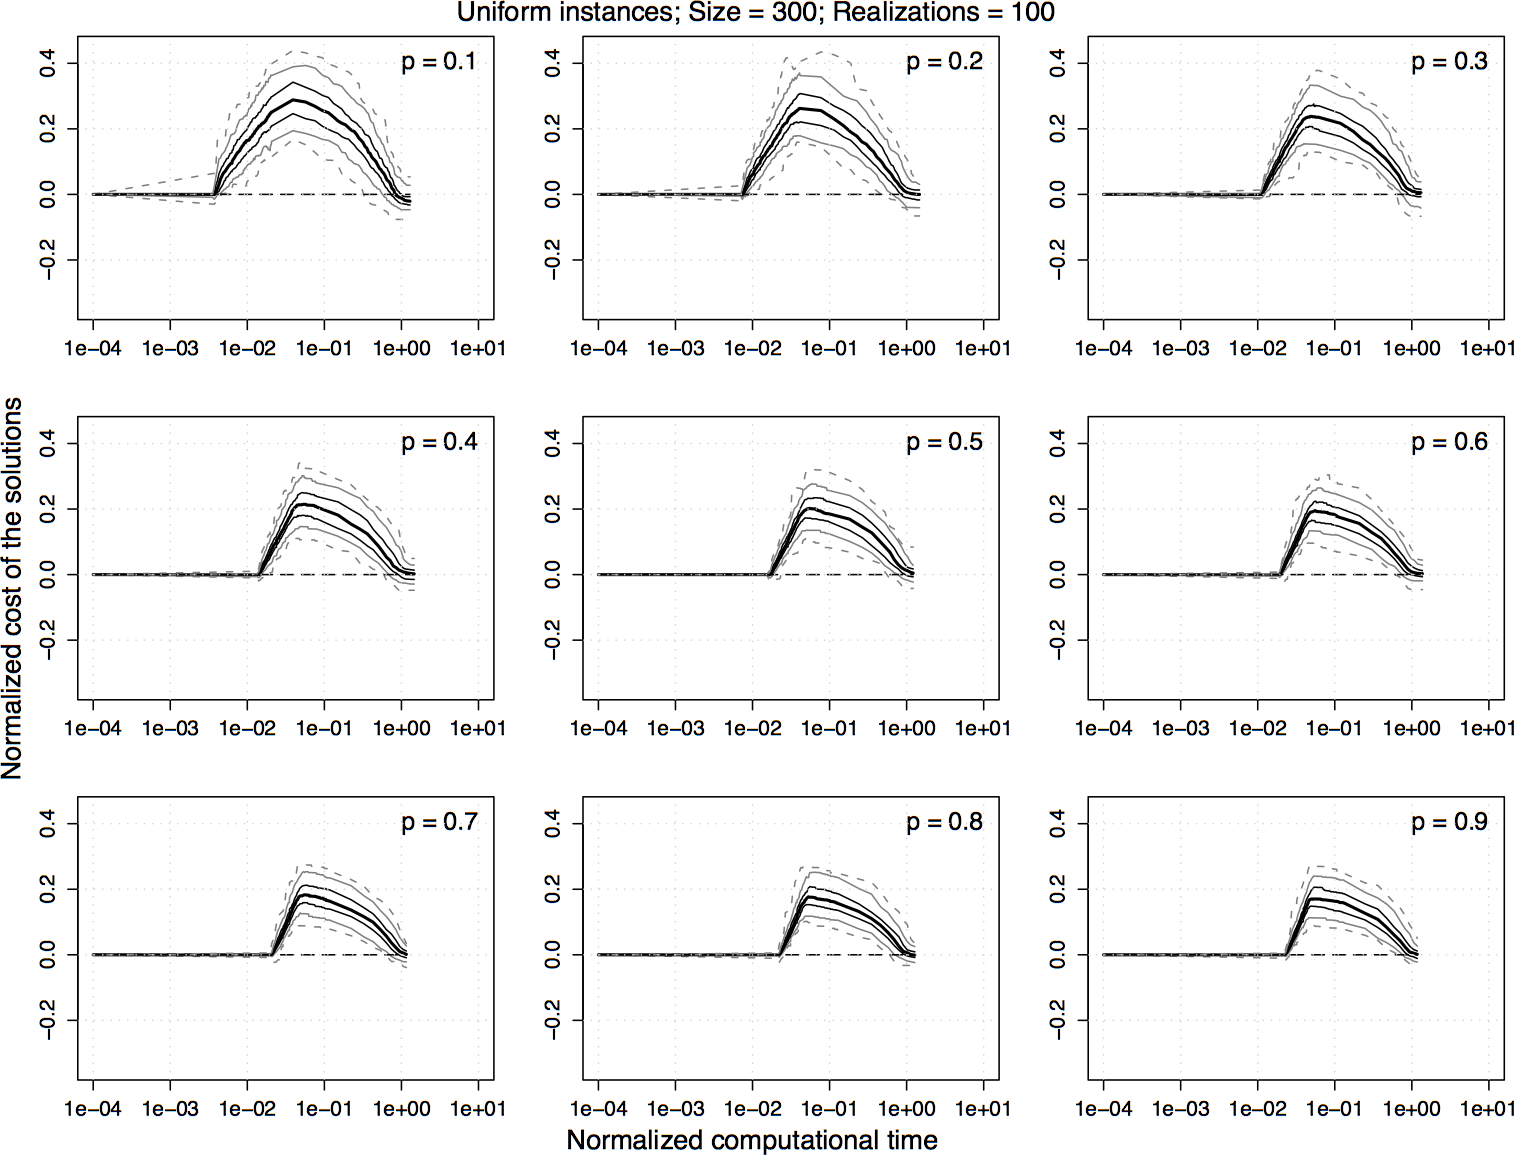
Experimental results on uniform homogeneous PTSP instances of size 300. For the normalized values shown in the previous plot, the difference between 2.5-opt-EEs-100 and 2.5-opt-ACs over time is computed and the 5%, 25%, 50%, 75%, and 95% quantiles of the distribution of the differences are plotted. For a curve, a value greater than zero indicates that 2.5-opt-EEs-100 is better than 2.5-opt-ACs and vice versa.
 |
|
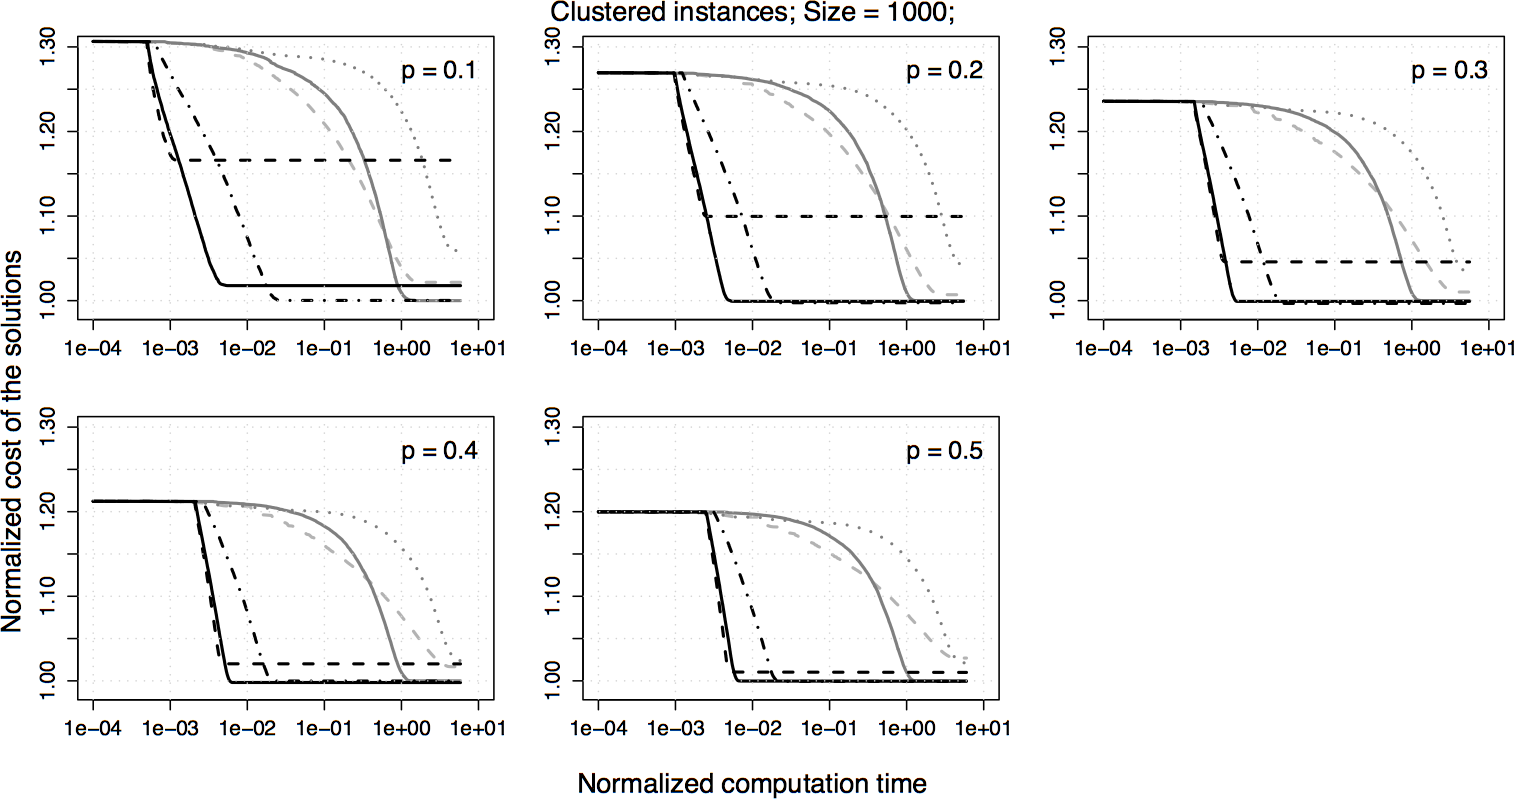
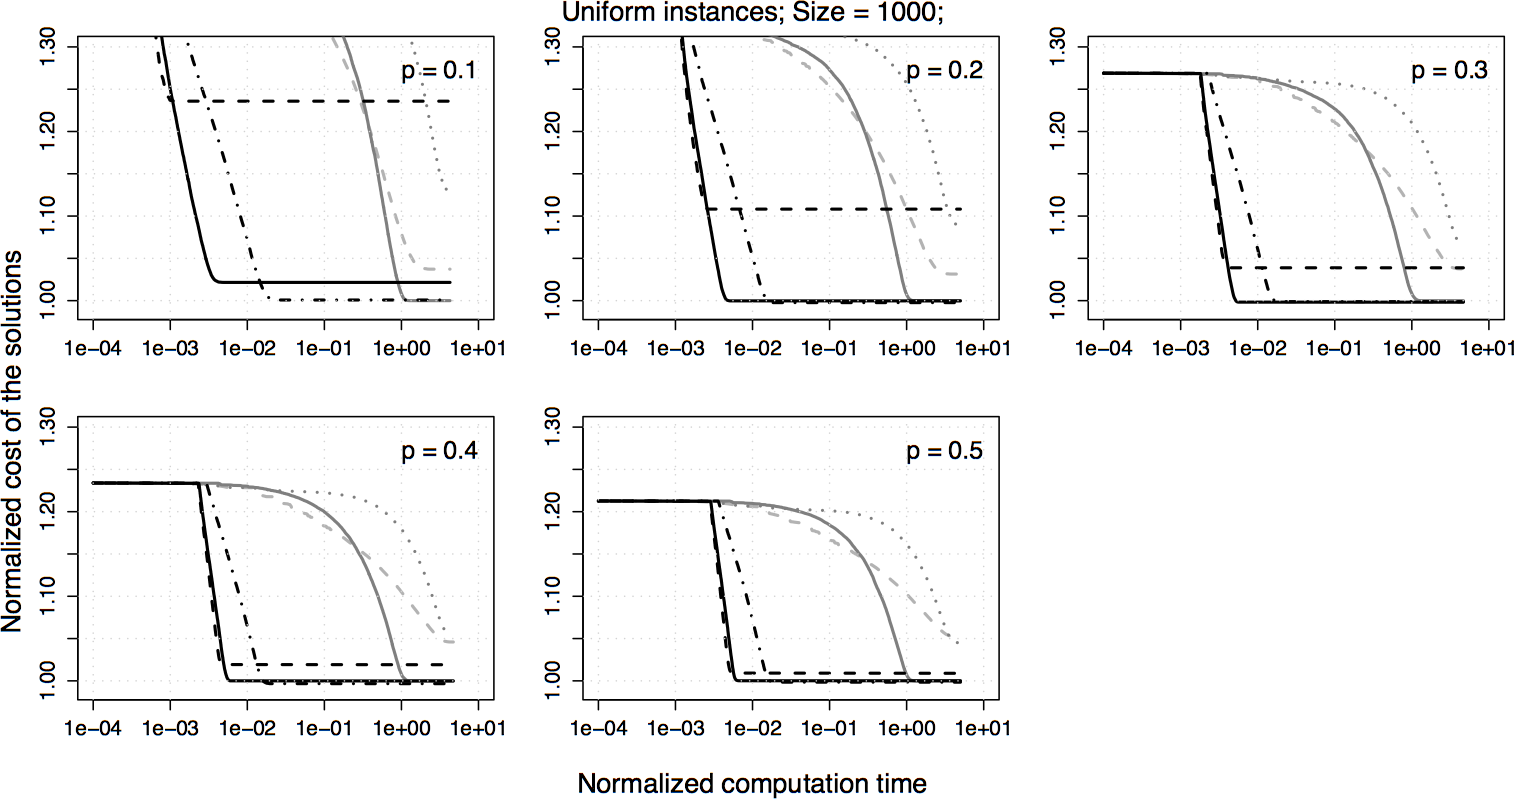
6. Experiments on large instances
6. Experiments on sampling strategies
7. Experiments on iterated local search
7. Numerical values and statistical results:
We also provide the absolute values for all the results in the form of tables. In these tables, we present the final solution quality and the corresponding computational time for each probabiltiy range. Moreover, in order to test that the observed difference between the cost of the solutions reached by the considered algorithms are significant in a statistical sense, we use a non-parametric test known as Wilcoxon test. We present the p-values obtained from the Wilcoxon test. Please note that all statistics shown in the table are given for 100 instances at each probability level. The results are composed in a single pdf file:
| Format |
|
PDF |
 (click the above icon to see/download the results) (click the above icon to see/download the results) |